How can I view the analytics of an account?
Antler App provides you with a comprehensive view of how your posts have been performing - including the posts that you haven't published using Antler App.
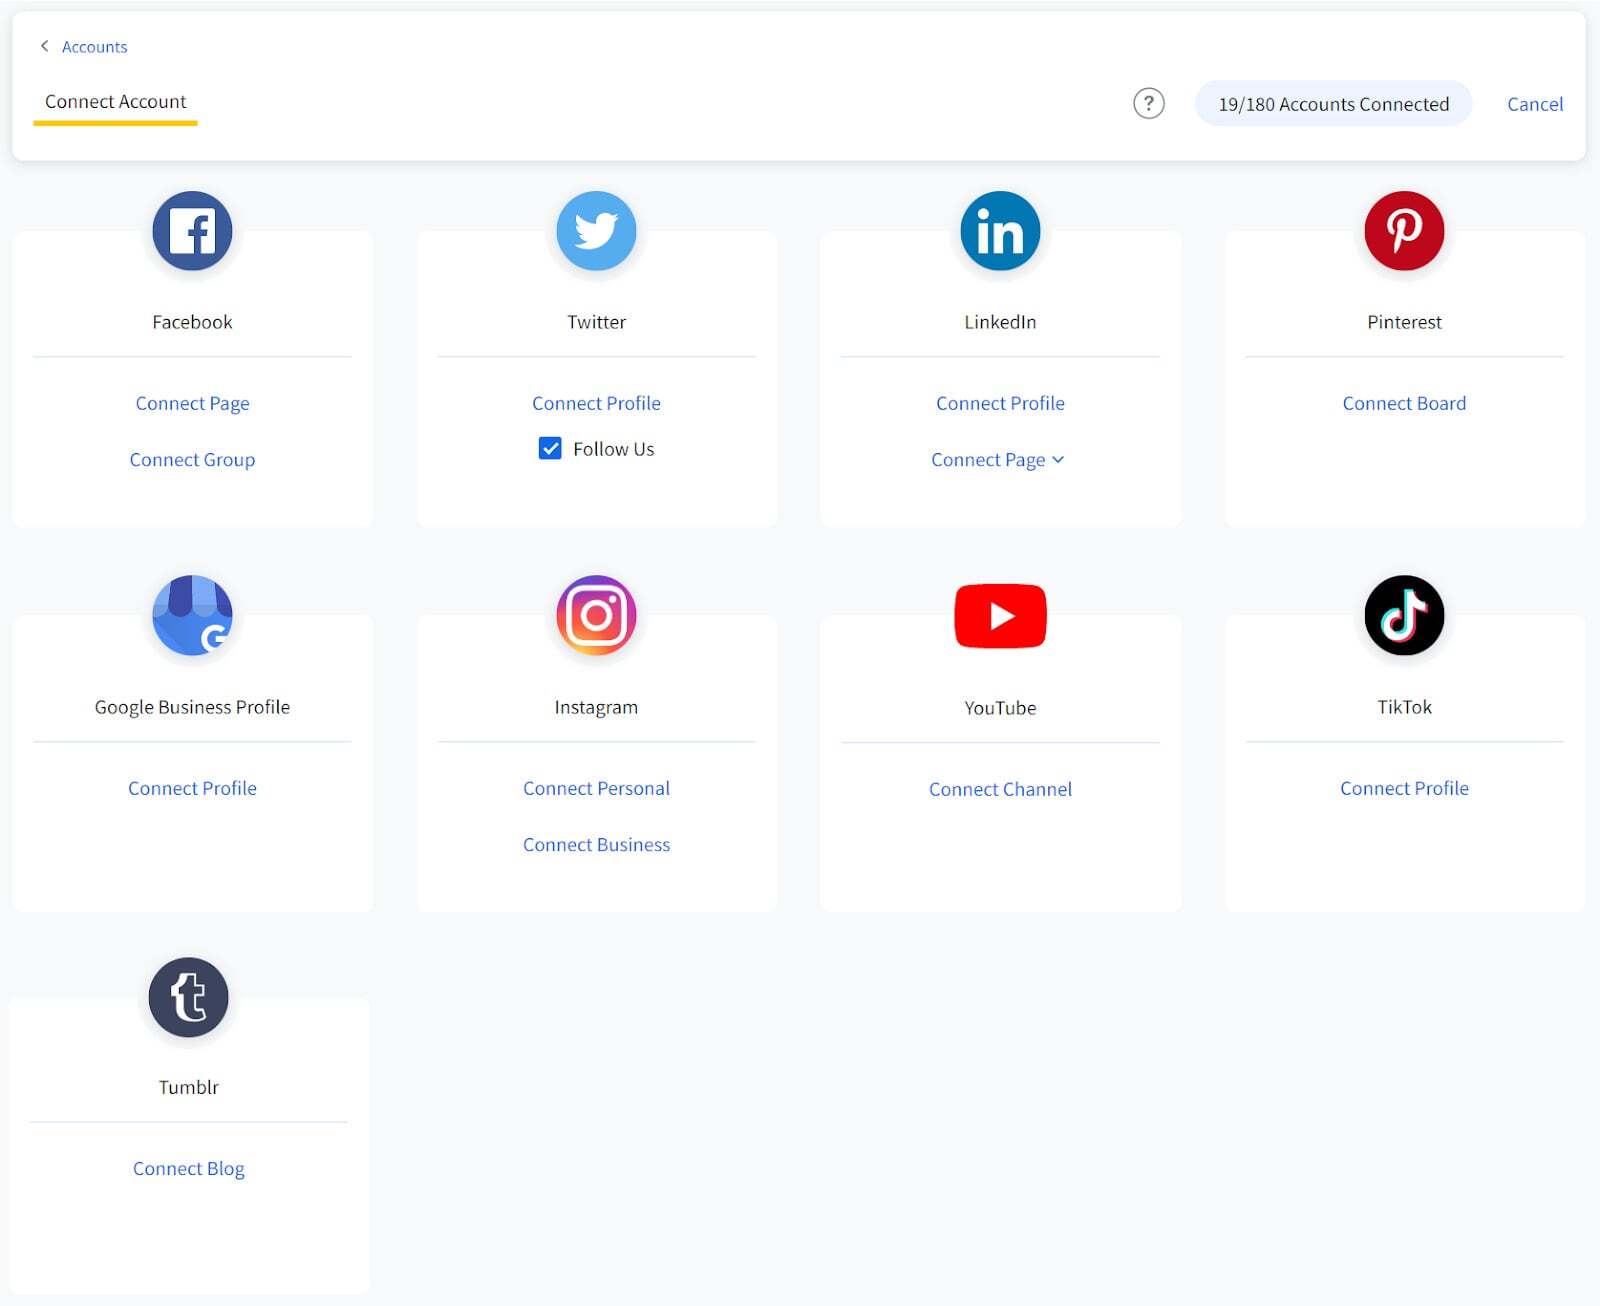
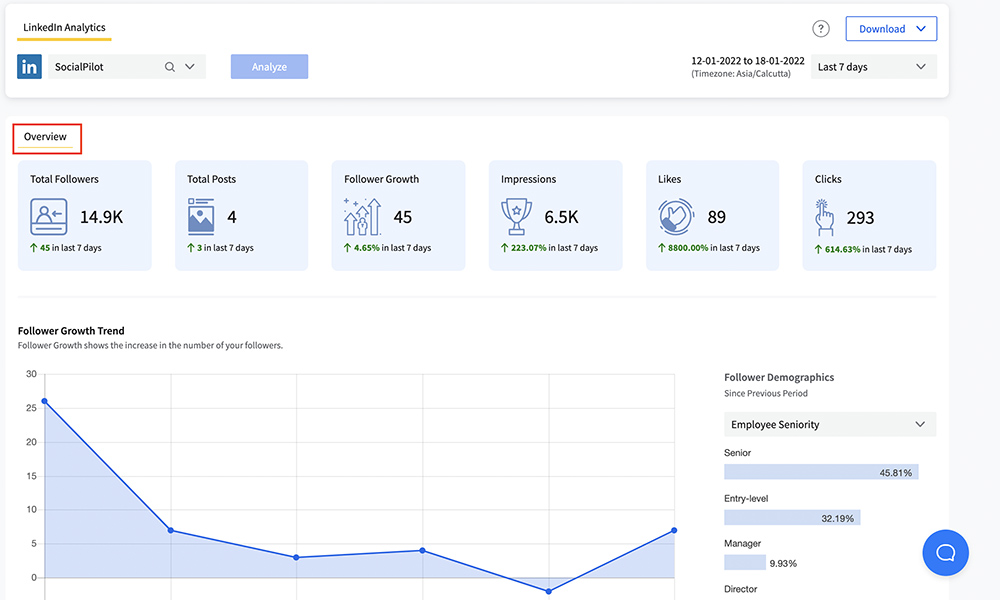
Currently, Antler App provides social media analytics for:
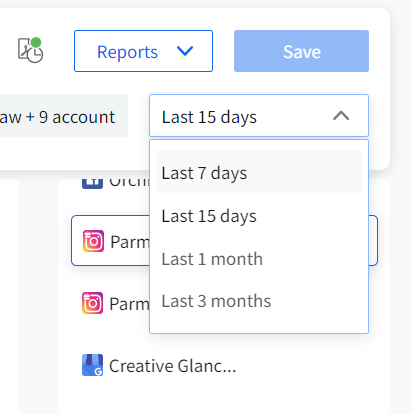
You can get an analysis for your accounts in these pre-defined time periods - 7 days, 15 days, 1 month, 2 months, and 3 months and a customized date range within the frame of 3 months. The timezone is set to PST by default. But you can change* it anytime following the steps here.
* The timezone will remain as PST for Facebook.
To view the analytics of an account:
Log into the Antler App panel.
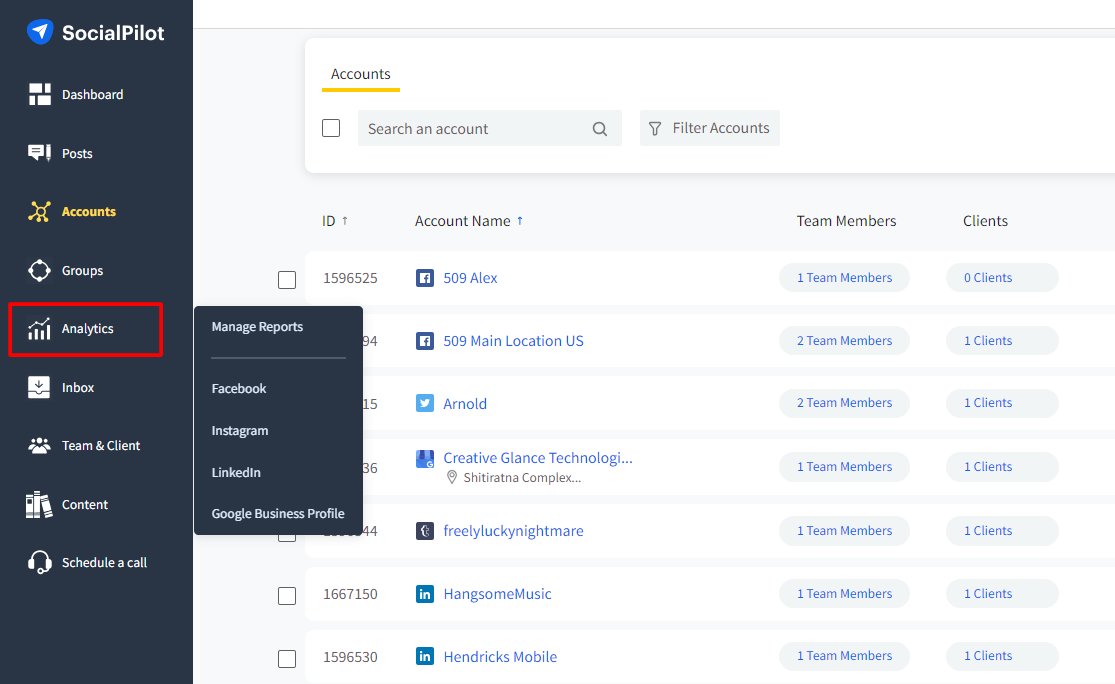
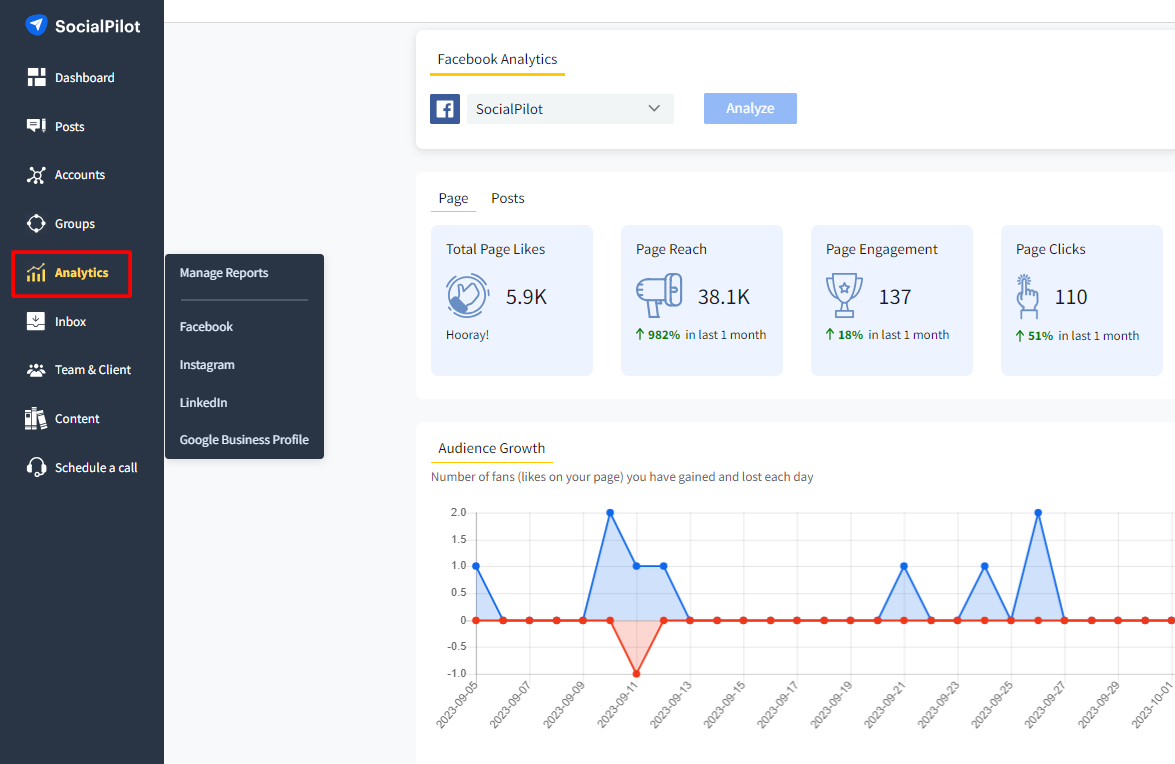
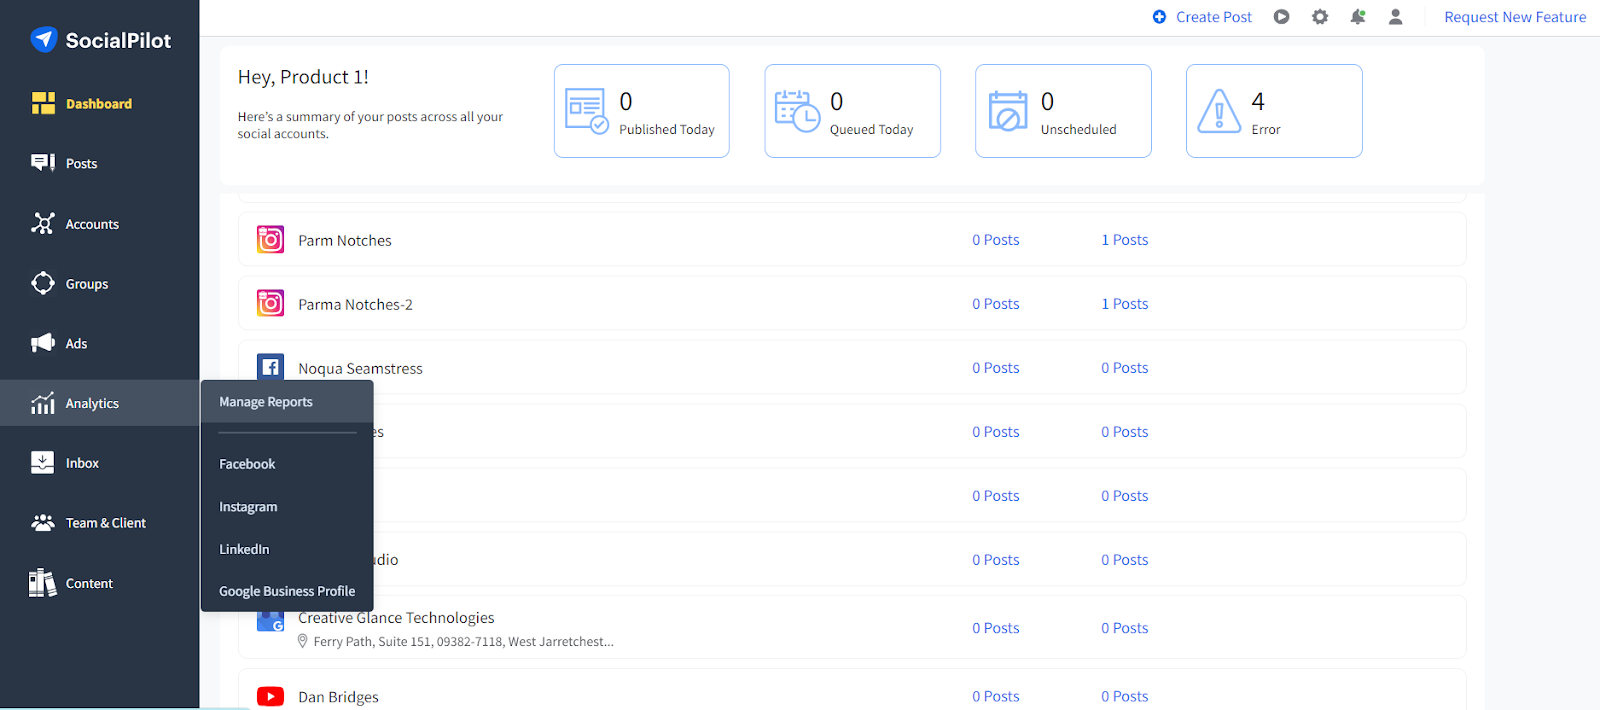
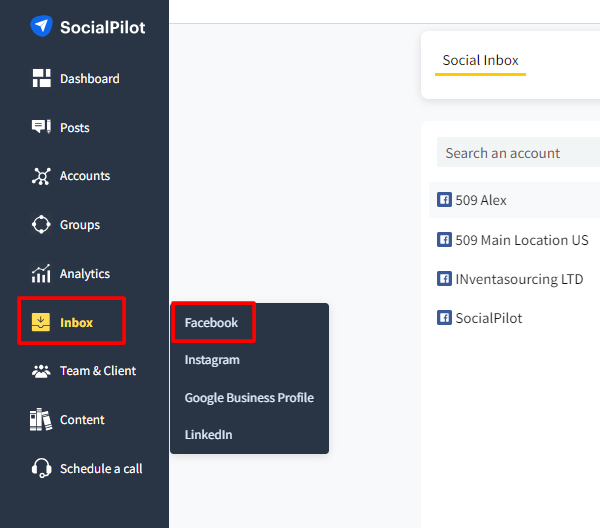
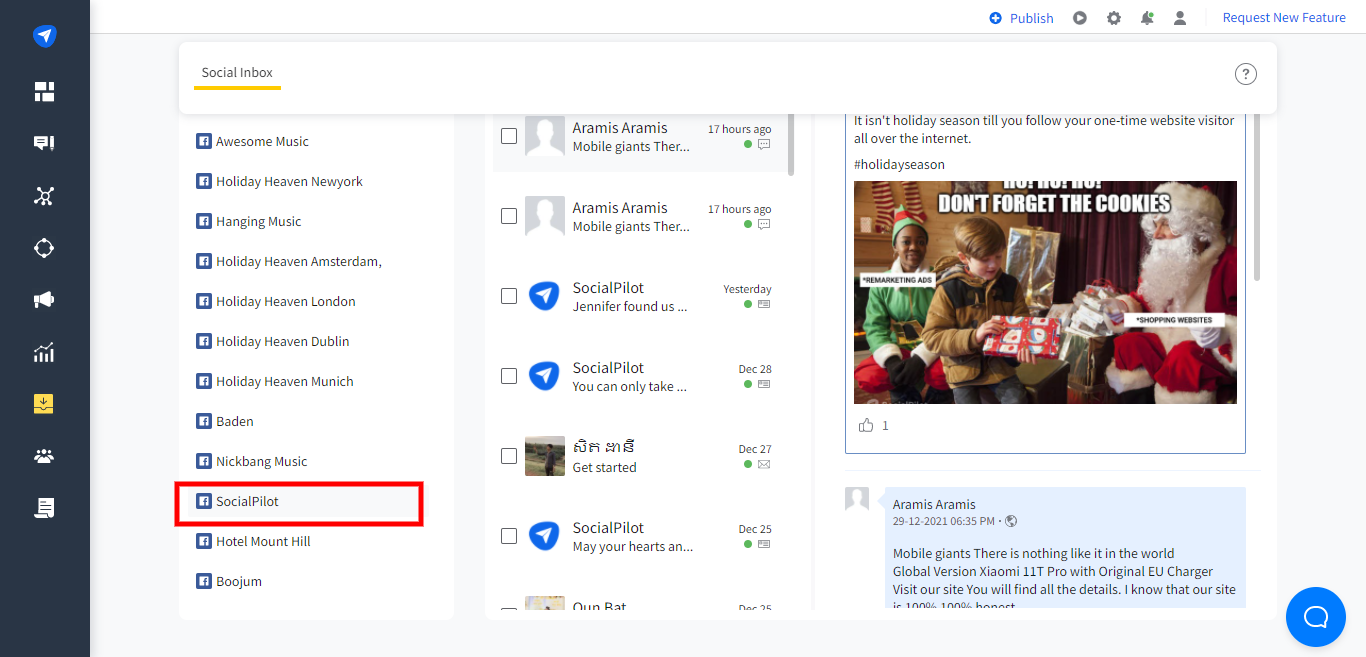
Click on 'Analytics'. Then, select the account for which you wish to view the analytics.
You'll be able to see the analytics for that account.
Even if you delete an account on Antler App, nothing happens to your data. As you connect your account again, analytics will read all the data from your connected account.
What does Google Business Profile analytics include?
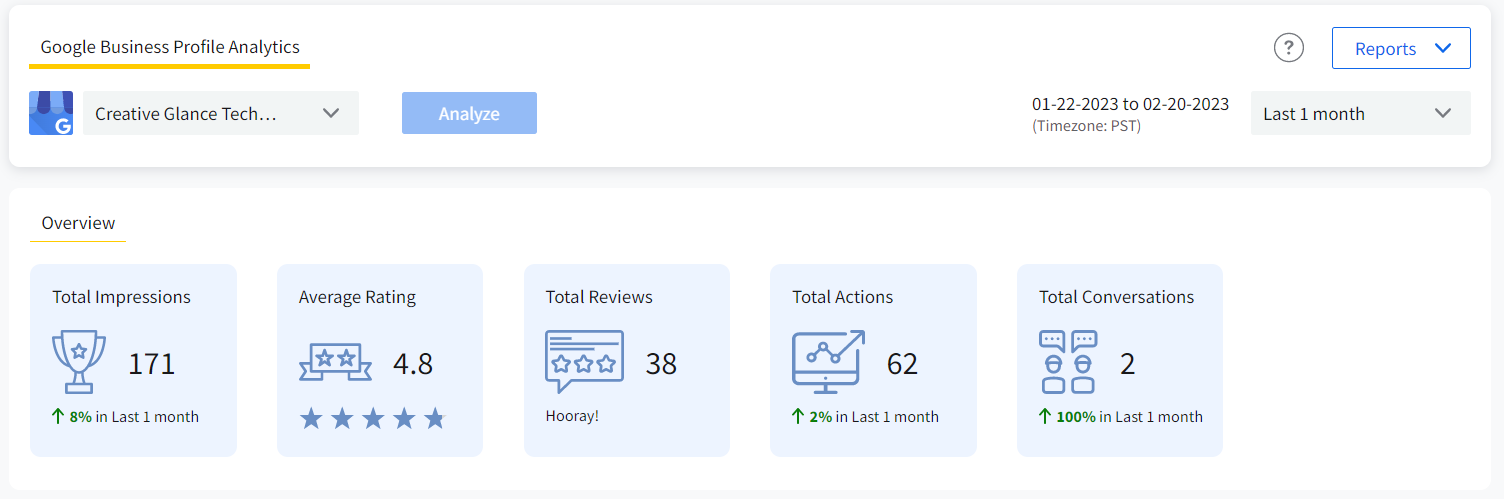
Antler App's Google Business Profile analytics reports give you a peek into how people find your business listing on Google, interact with your posts, and act after visiting your listing. You can get insights for selected listings for up to 3 months or any customized time period within that. We give you all the metrics for Google Business Profile according to PST.
Overview
Gives you a general idea of how your posts for the selected location have performed. The information will be based on the duration you select. This means any impressions, reviews, activities, etc., made on your Google Business Page before the selected period will not reflect here.
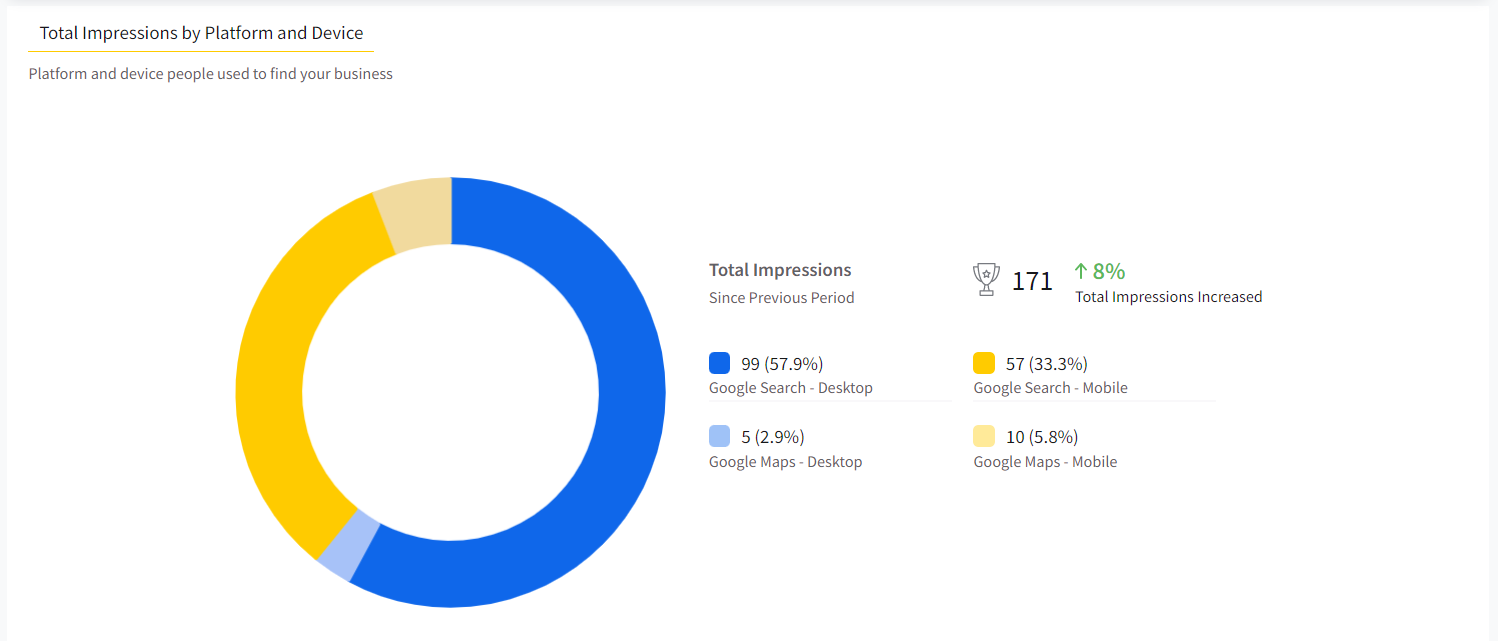
How do Customers Find Your Business?
Shows a breakdown of all the impressions your page got through Google search or maps. The graph also shows whether those impressions were received on a desktop or mobile device.
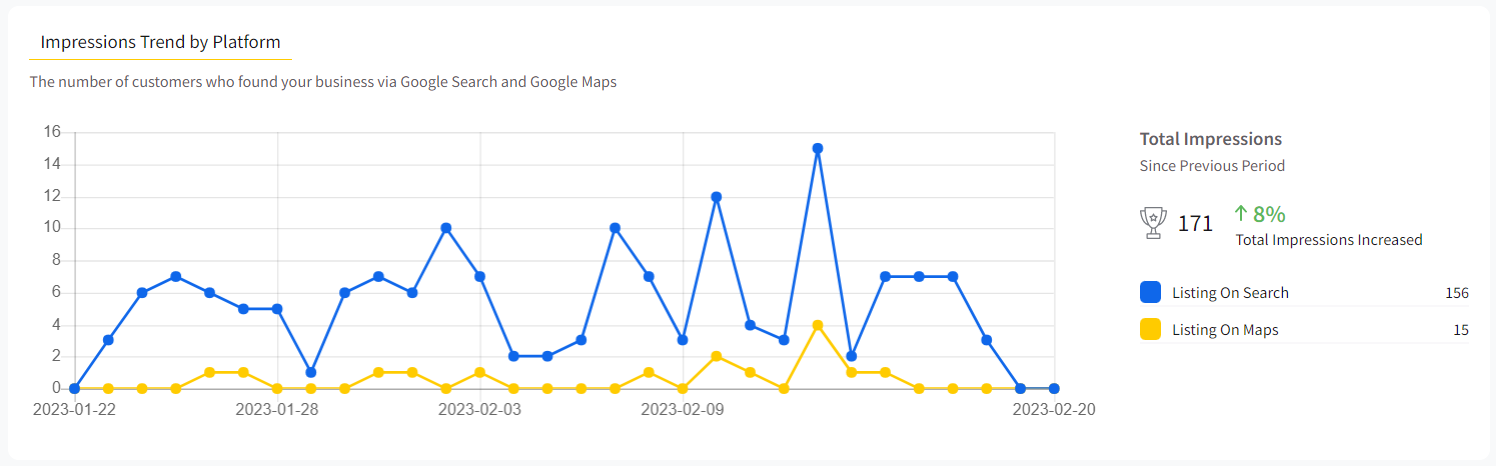
Where Do Customers Find Your Business On Google?
Insights show how many customers found you via Google Search or Google Maps within the selected period of time. See the number of views your listing received:
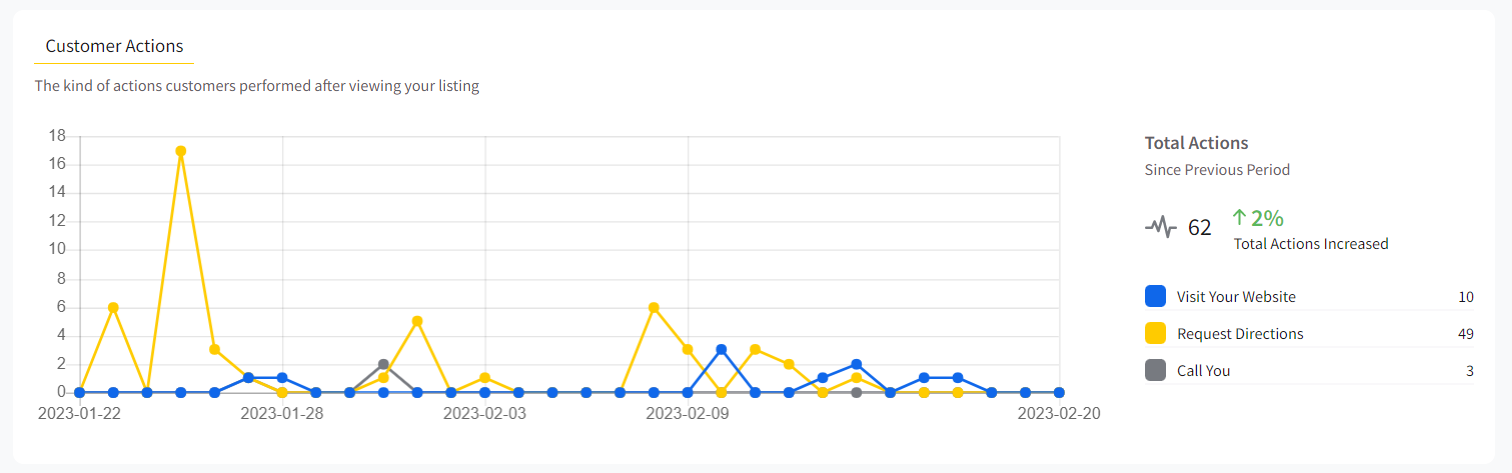
Customer Actions
Shows how customers behave after they found your listing on Google. See the types of actions your customers performed when viewing your listing:
Visit your website: Number of customers who viewed your website.
Request directions: Number of customers who requested directions to your business.
Call you: Number of customers who called your business.
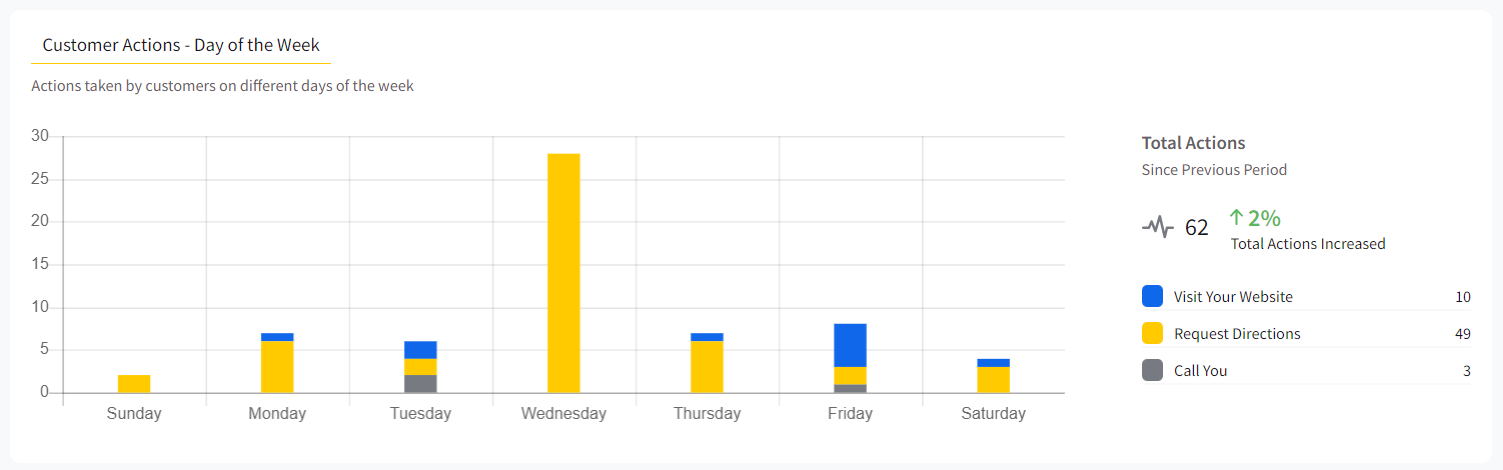
Customer Actions- Days of the week
Shows a graphical breakdown of the actions taken on your listing on each day of the week for the selected time period.
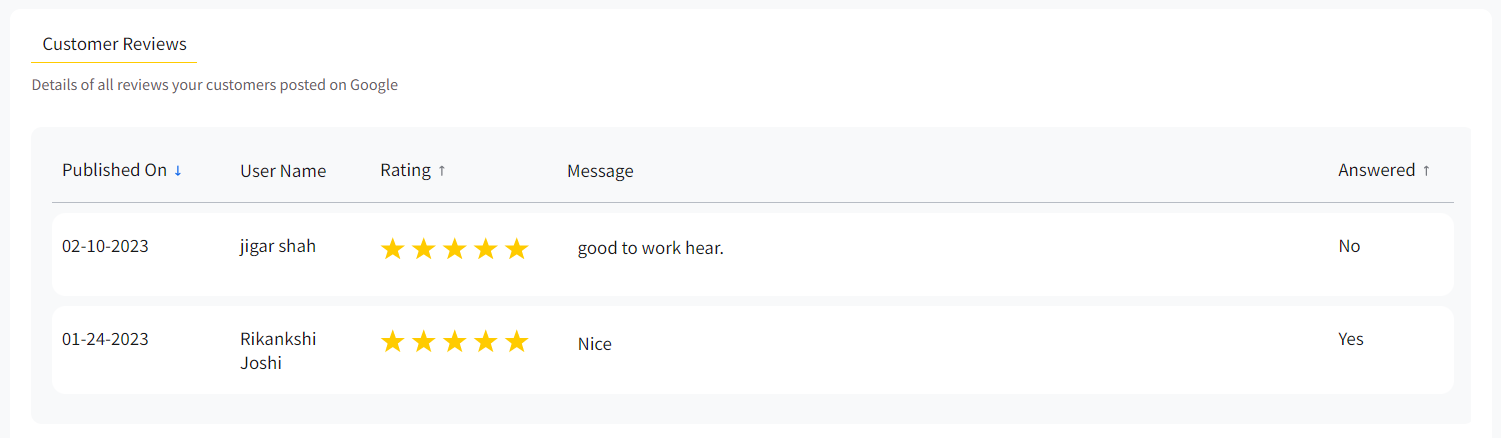
Customer Reviews
You will be able to see every review your listing has received within the selected time-period. Check out the dates they were given, the name of the person who wrote them in the specific time period, along with the star rating given to your page. You can check at a glance whether you have responded to a review or not.
What does Facebook analytics include?
Our Facebook Analytics inspect every connected Facebook Page and provides in-depth reports you can access from a single dashboard.
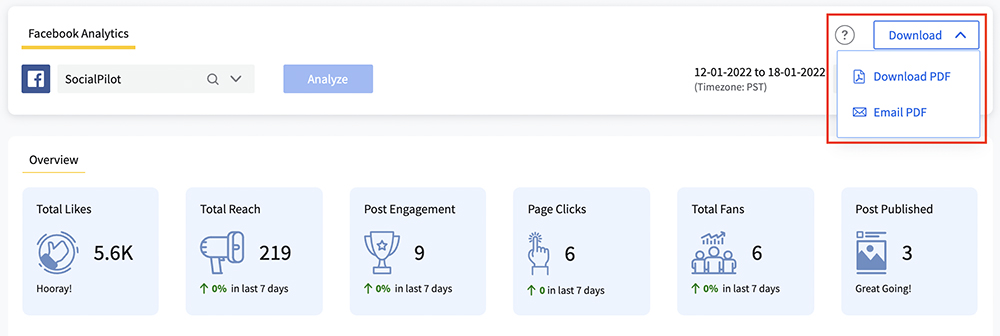
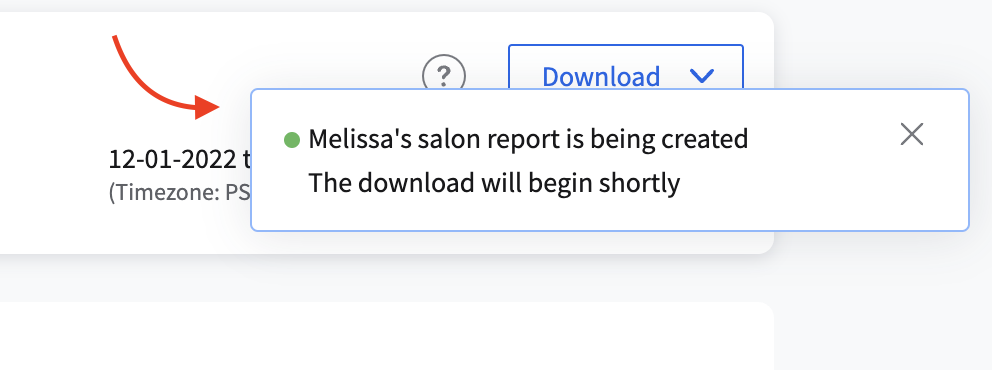
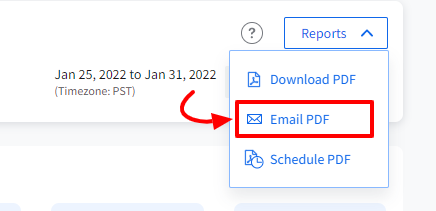
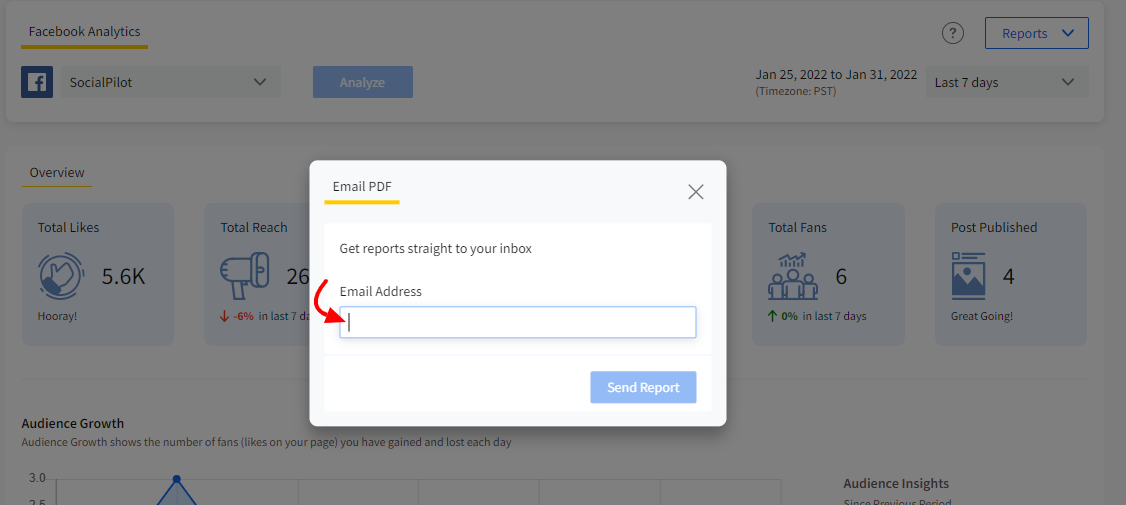
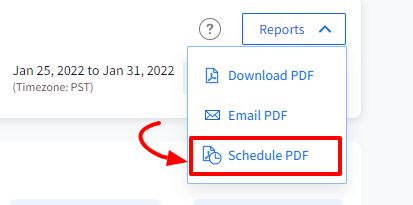
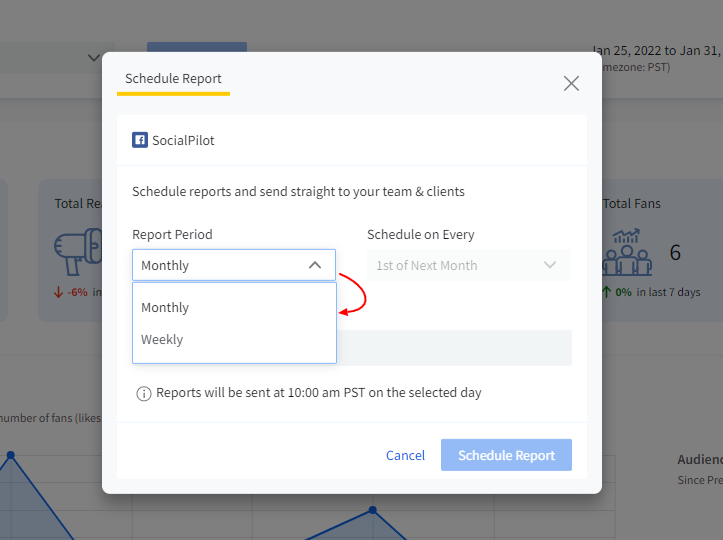
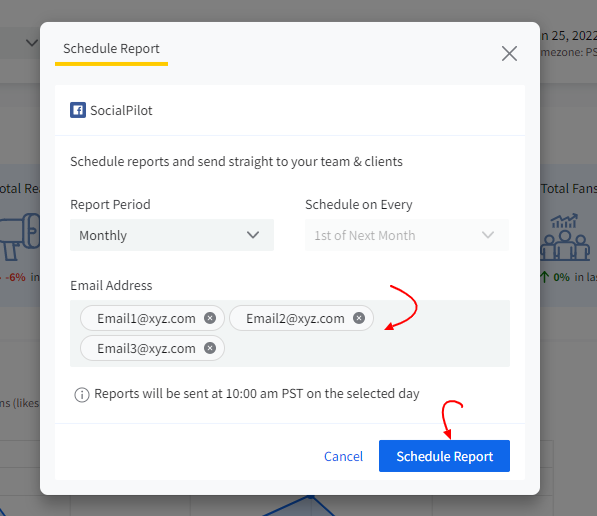
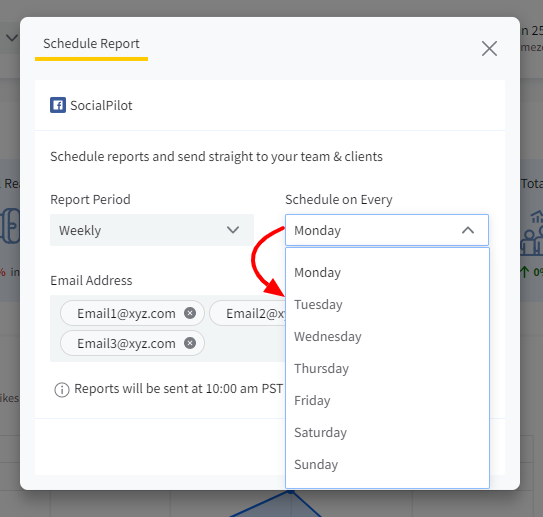
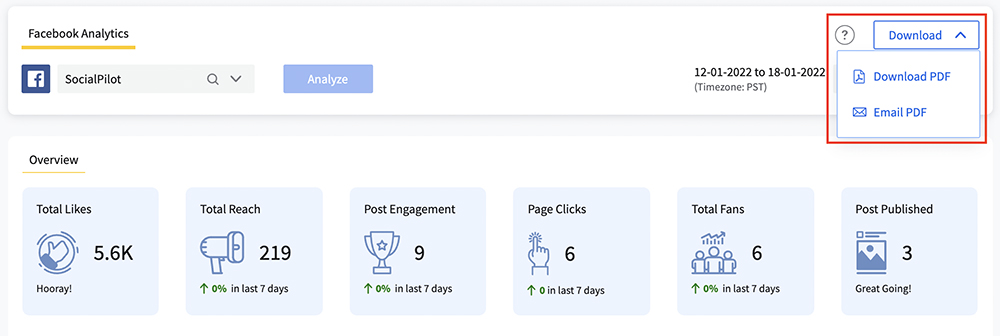
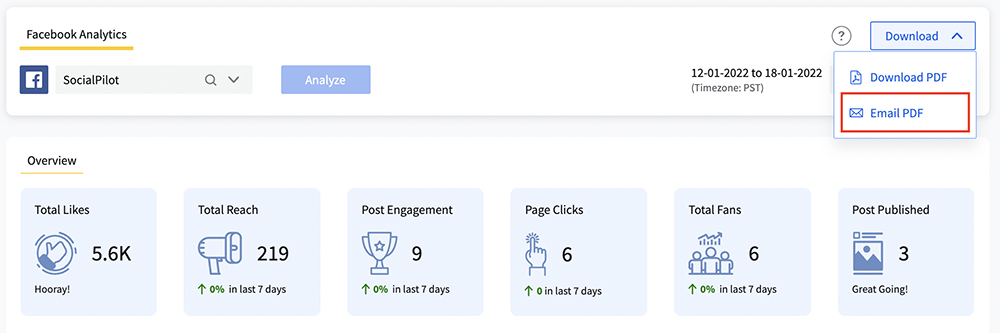
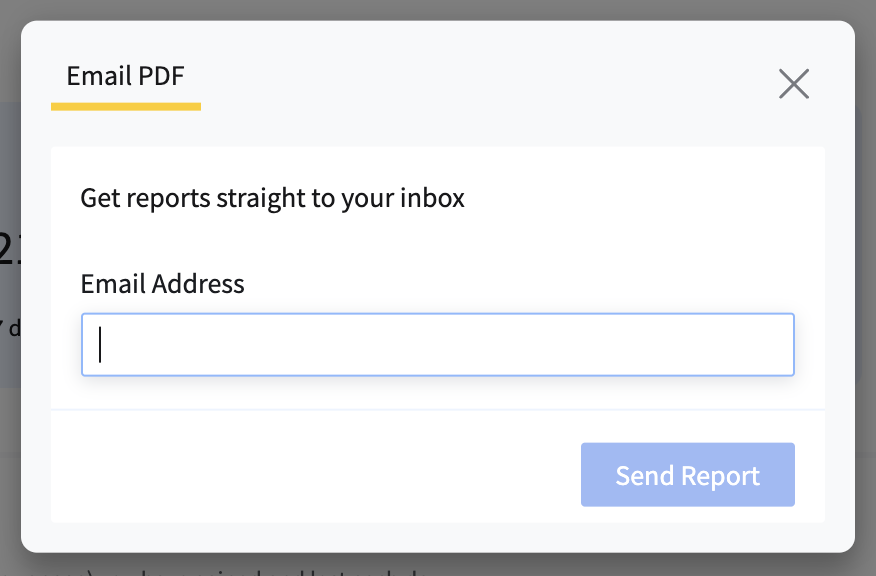
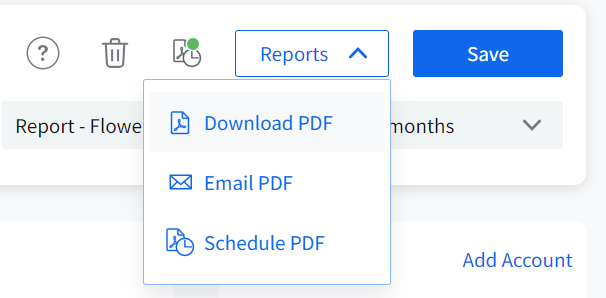
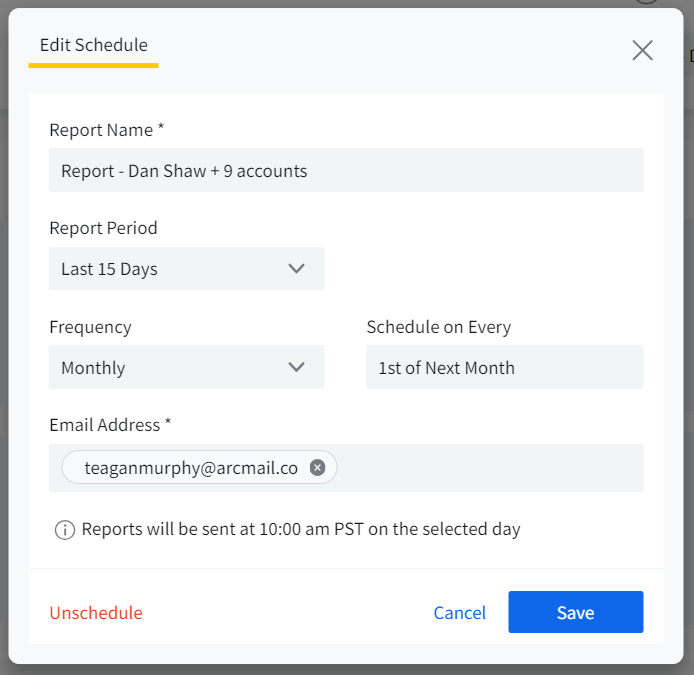
Generate PDFs of these reports, download, email, or schedule them to send to others with a few clicks. Antler App enables you to add your logo and name to these reports and share them with your clients. You can choose to see the data for the last 7 Days, 15 Days, 1 Month, 3 Months, or between any dates within the last 90 days. Only with Facebook can you select a custom date range to view reports.
Analytics for Facebook pages is divided into two sections, which are Pages and Posts
The Page section shows you insights into how your page performs overall, follower growth, impressions, engagement, active fans, etc. The Post section of the Analytics details the type of content you have been posting and how they perform regarding reach and engagement, shares, etc. For video content, including Reels and other videos, you can see the view time as well.
Let us go through each of the above-mentioned sections and the metrics under them one by one.
PAGE ANALYTICS
Here are the elements and related metrics you get to see under the Antler App Facebook analytics Page section.
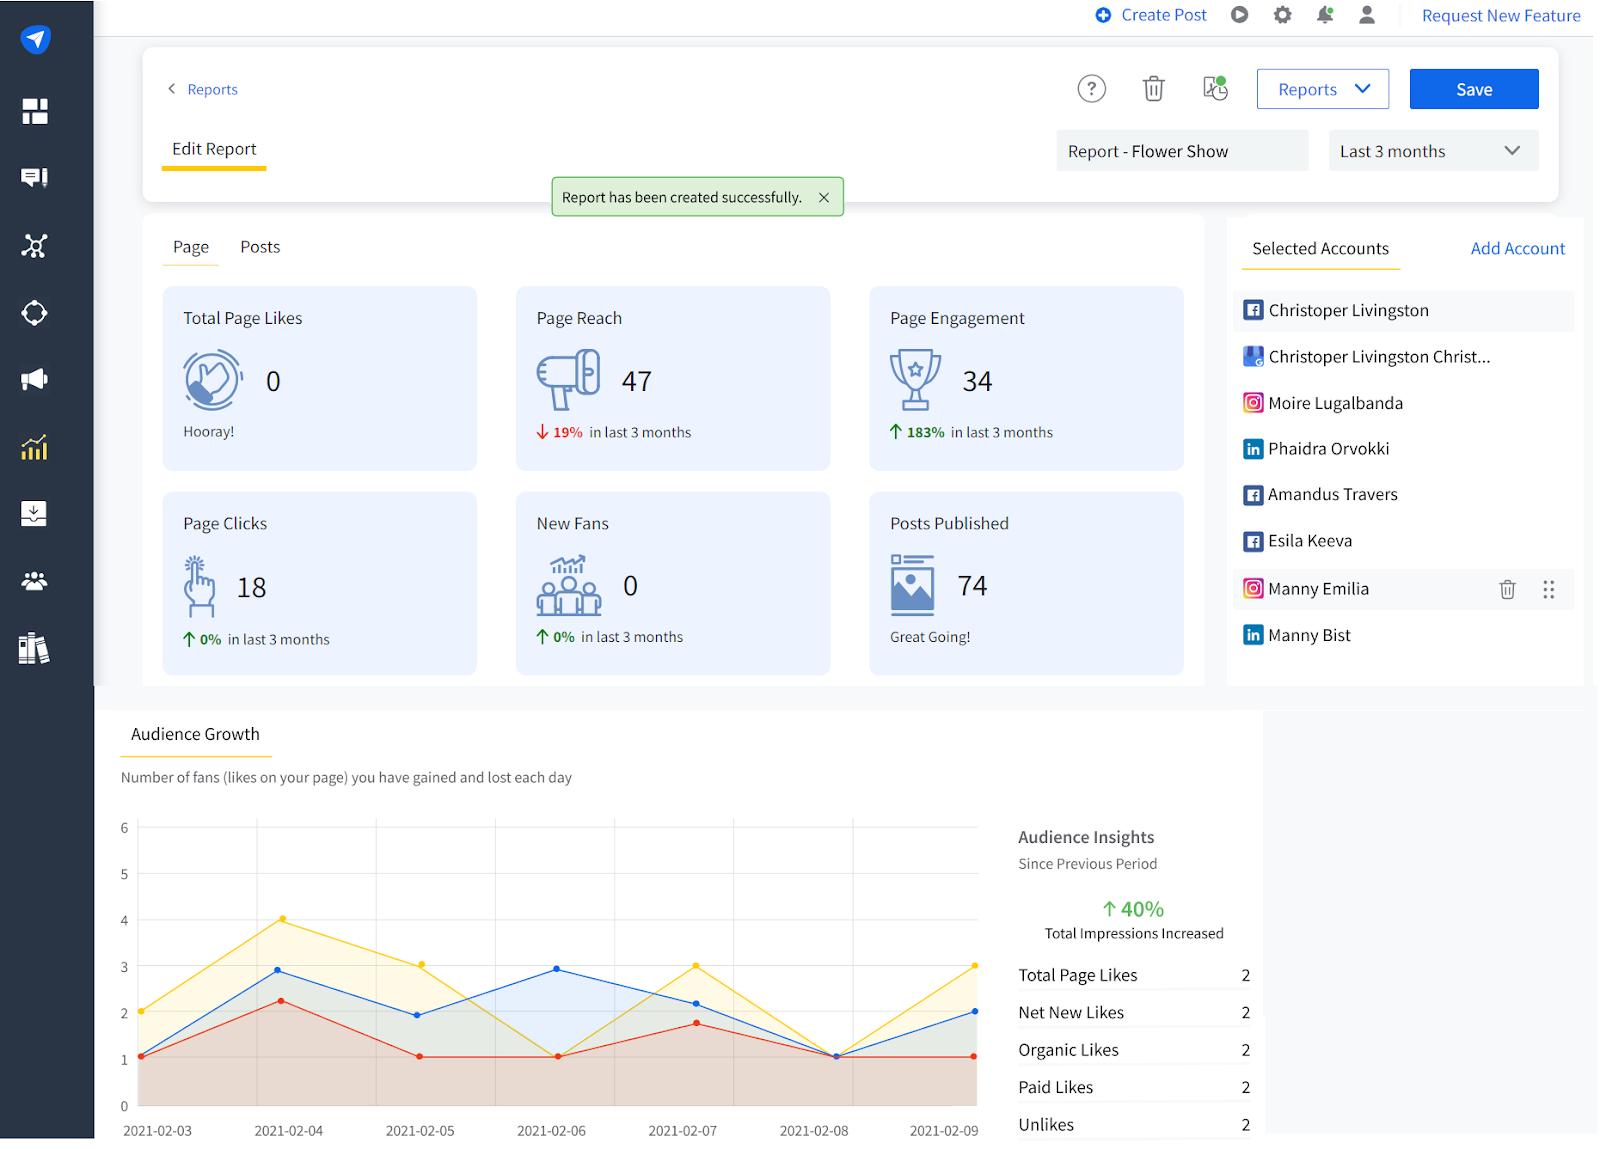
The Overview
Gives you a general idea of how your posts for the selected Facebook page have performed. The overview shows the following metrics
Total Page Likes - The unique number of likes your page has received since its inception.
Page Reach - Number of people who saw content from your page or about your page on their screens.
Page Engagement - This metric gives the total number of times people interacted with content from your page, which includes likes, comments, and shares.
Page Clicks - Total number of clicks on your page on any content without generating a story.
New Fans - The number of new people who liked your page in the selected time period.
Posts Published - Number of posts published in the time frame selected by you. These include texts, links, images, videos, polls, etc.
Except for total page likes and posts published, every metric under the overview section is given along with the percentage of its change compared to the number in the previous time period. This means that if you opt to see the data for the whole month of January, the analytics will calculate the percentage of increase or decrease in the numbers compared to those in December.
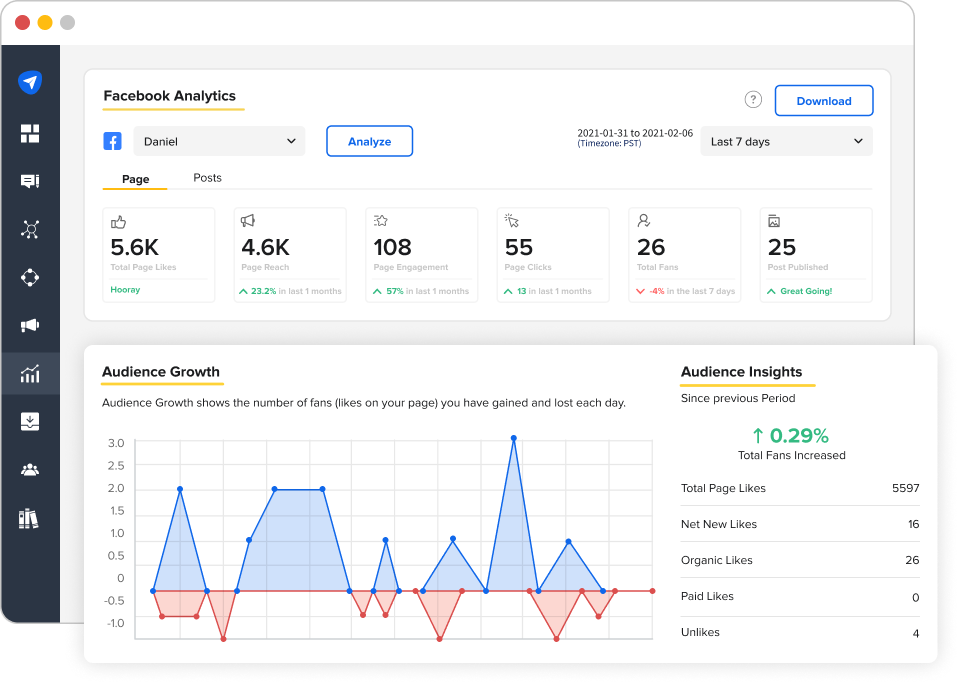
Audience Growth
Audience growth is available just below the overview, and it gives you the number of Likes and Unlikes you have received on your page for the selected time period.
The percentage given under Audience Insights shows the percentage of change in the number of fans (people who liked your page) in the present time period compared to the one previous to it. Meaning the number of page likes in the week of 31st January to 6th February is 0.29% more than the page likes' number from 24th to 30th January.
Total Page Likes - This refers to the current number of likes your page has had since its inception.
Net New Likes - This refers to the unique number of new likes added to your net likes in the selected time period.
Organic Likes - TLikes received on posts that did not have any paid promotion.
Paid Likes - Likes received on posts with paid promotion.
Unlikes - Posts that were un-liked by the audience.
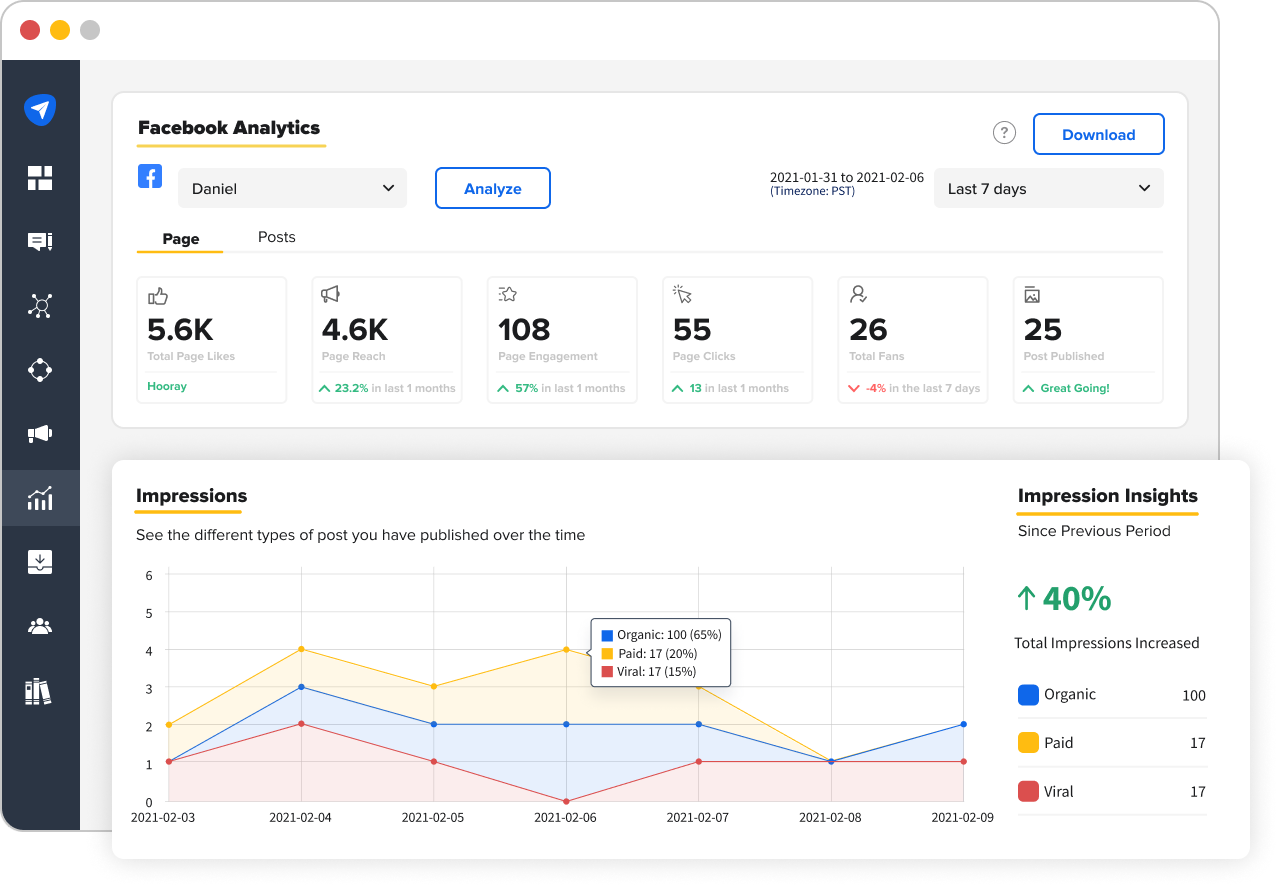
Impressions
The metrics tell you the number of times any content from your page appeared on the audiences’ screens. The impressions gotten from organic and paid means are both shown separately. Viral impressions are the percentage of impressions your content gets from people because their friends interacted with it.
According to Facebook Insights, viral reach is a type of organic reach. When people interact with your page by liking, sharing, following, or visiting, content from your page also appears on their friends’ screens.
Impression Insights shows the percentage change in the total number of impressions, comparing the numbers in the selected time period with the previous one. So if you have selected the data for the month of January, it will compare that number to the ones of December, which are stored in the tool's database.
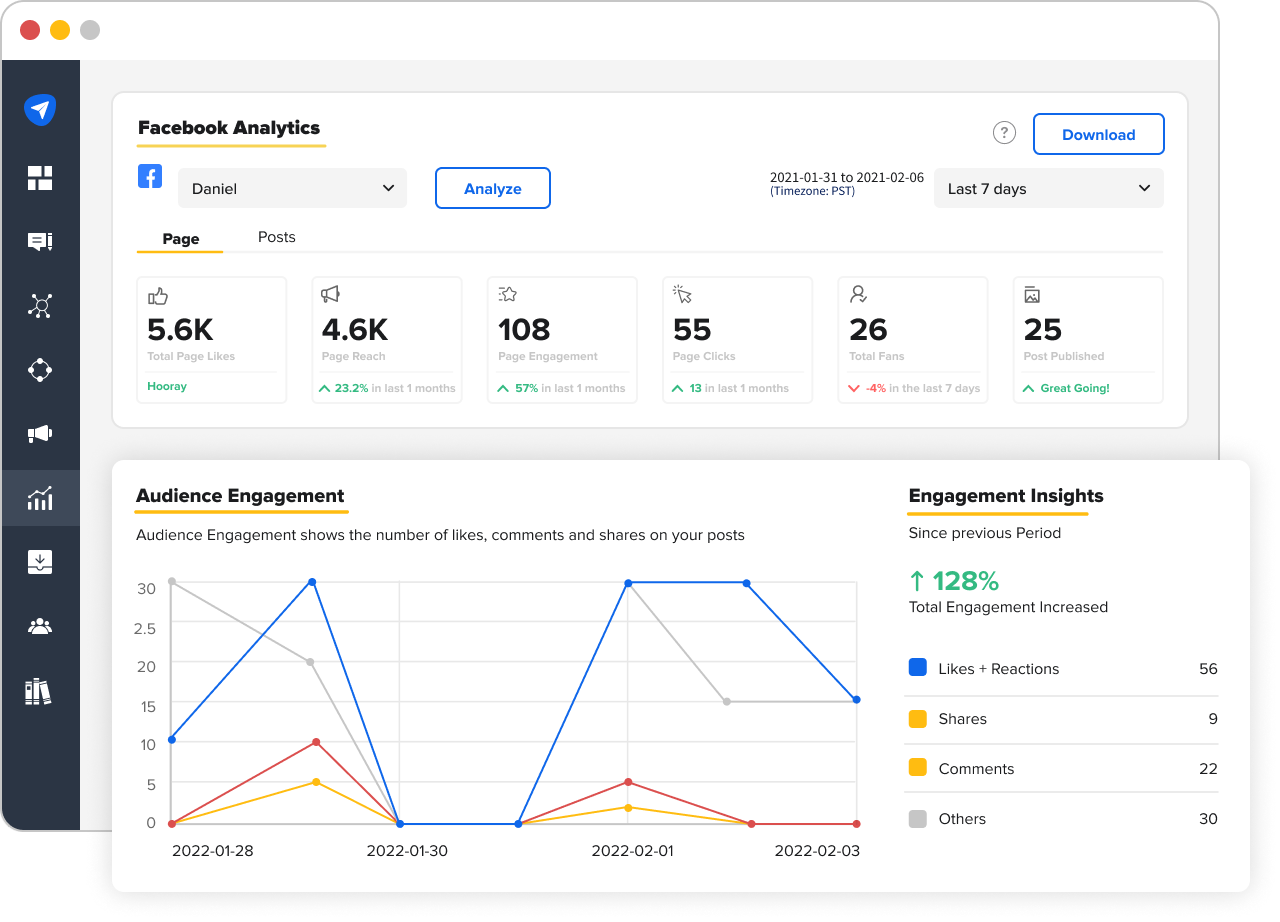
Audience Engagement
Provides you with all the metrics that show how your audience interacted with your posts with some click actions- likes, reactions, comments, and shares or any other type of activity such as answers, claims and check-ins.
You can see the number of times your audience has engaged with your posts in the form of reactions, comments, shares, and other types of actions in the graph.
Engagement Insights gives you the changed percentage in the number of audience engagements received by your page, comparing the numbers of your chosen time period to the one previous to it. In the above screenshot, the engagement numbers for the first week of January are compared to those for the last week of December. And the engagement in the current week has gone up by 128% with respect to the previous week.
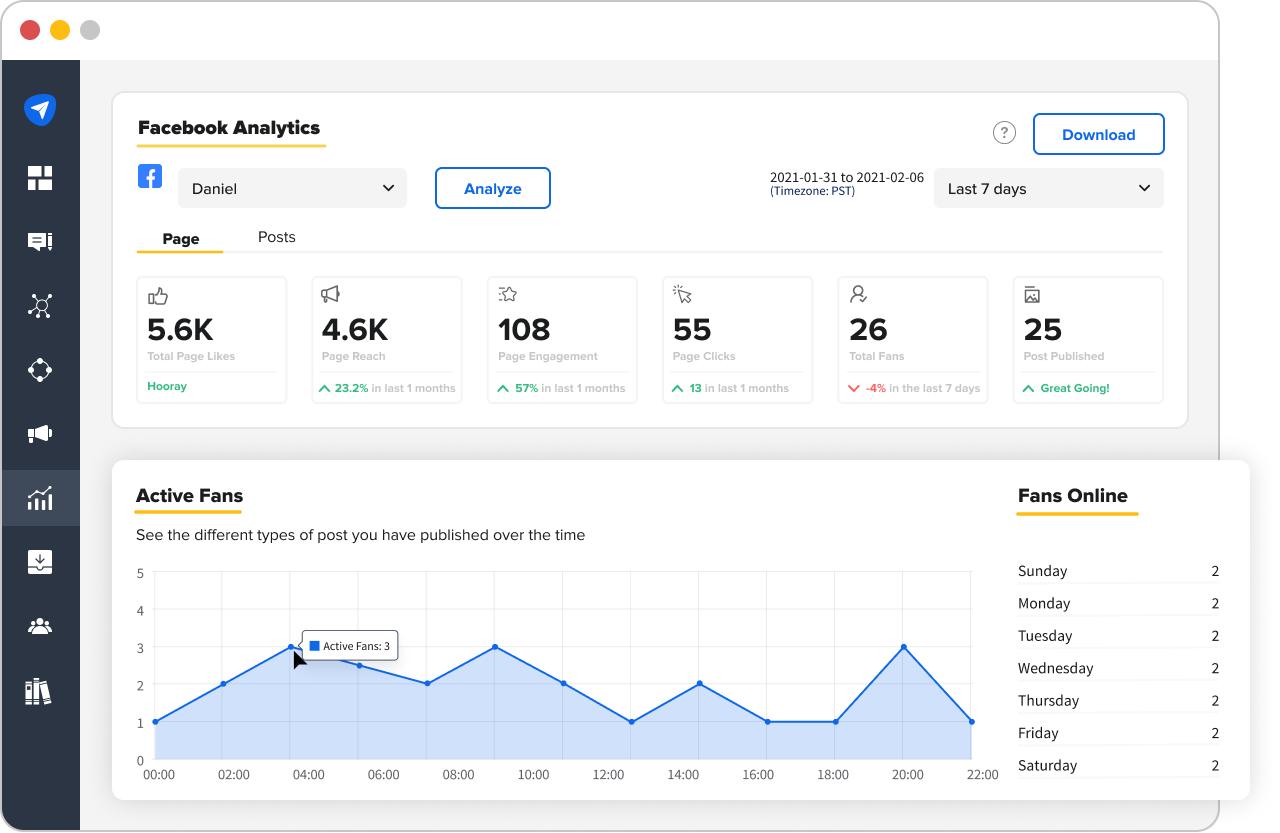
Active Fans
Fans refer to all the people who've liked your Page. Active Fans are the number of fans who are active on Facebook at a specific time of the day. Under Fans Online, you can also see the breakdown of the number of active fans each day of the week.
Note: The timings given in Antler App are all in PST. So if you want to find the exact time of your fans' activity, you have to convert these times accordingly.
With the graph, you can see when your audience is the most active and hence, can share content during that time period to get maximum engagement.
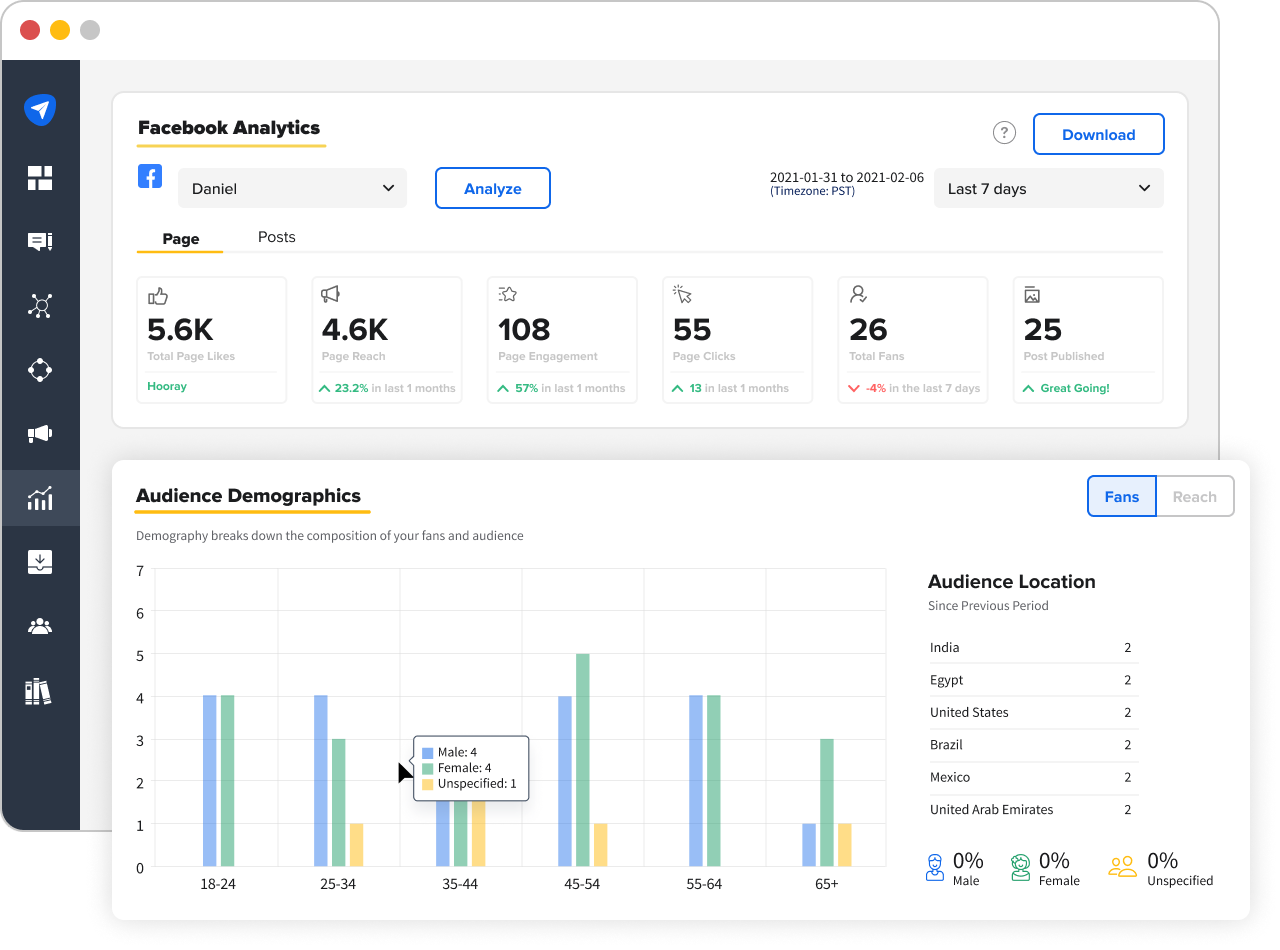
Audience Demographic
Provides you with insights about your audience - the number of male, female, and other fans, their age groups, their location, etc. You can also see the percentages of each gender in your audience for the selected time range.
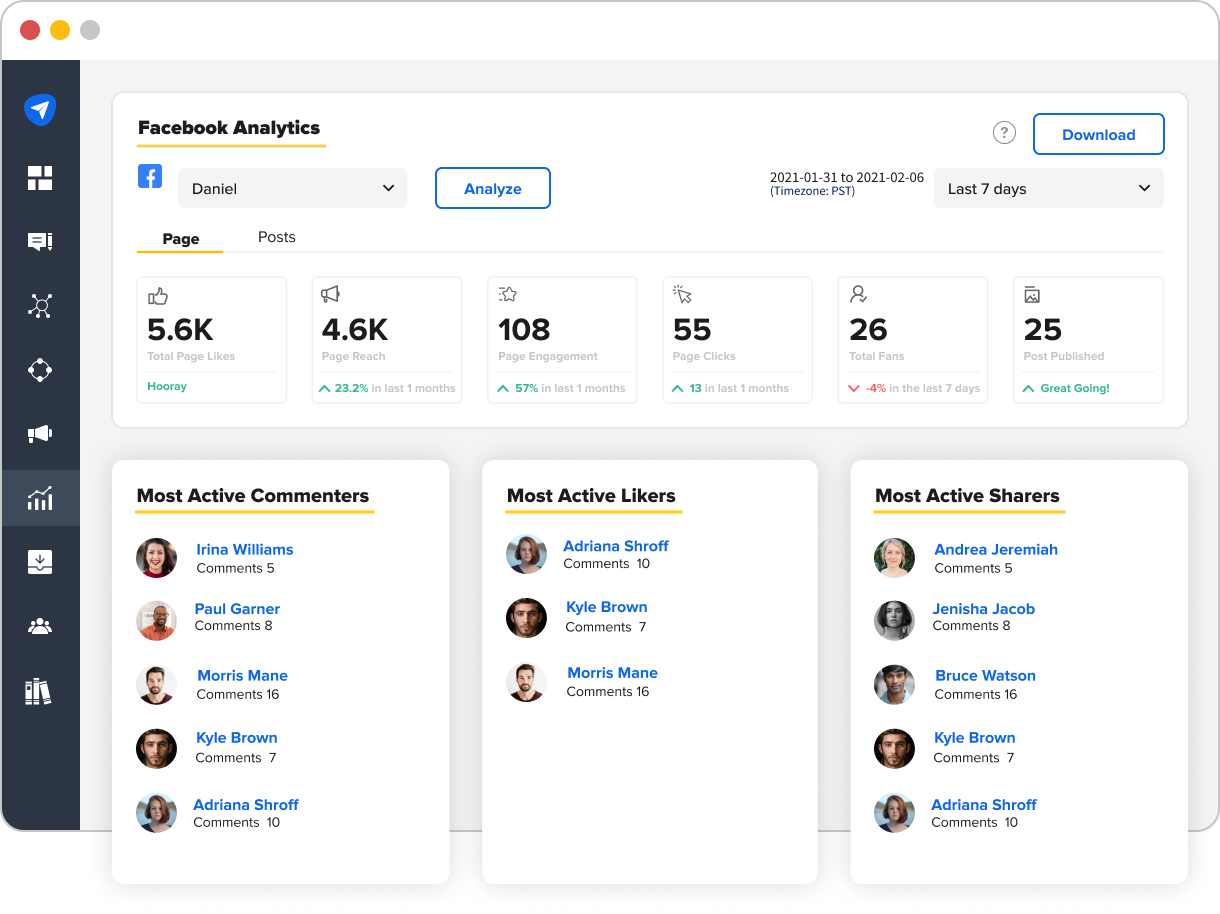
For the specified time period, you can also see the Most Active Commenters, Most Active Likers, and Most Active Sharers.
POST ANALYTICS
Just like the Page analytics, the Post section also starts with the Overview.
The Overview
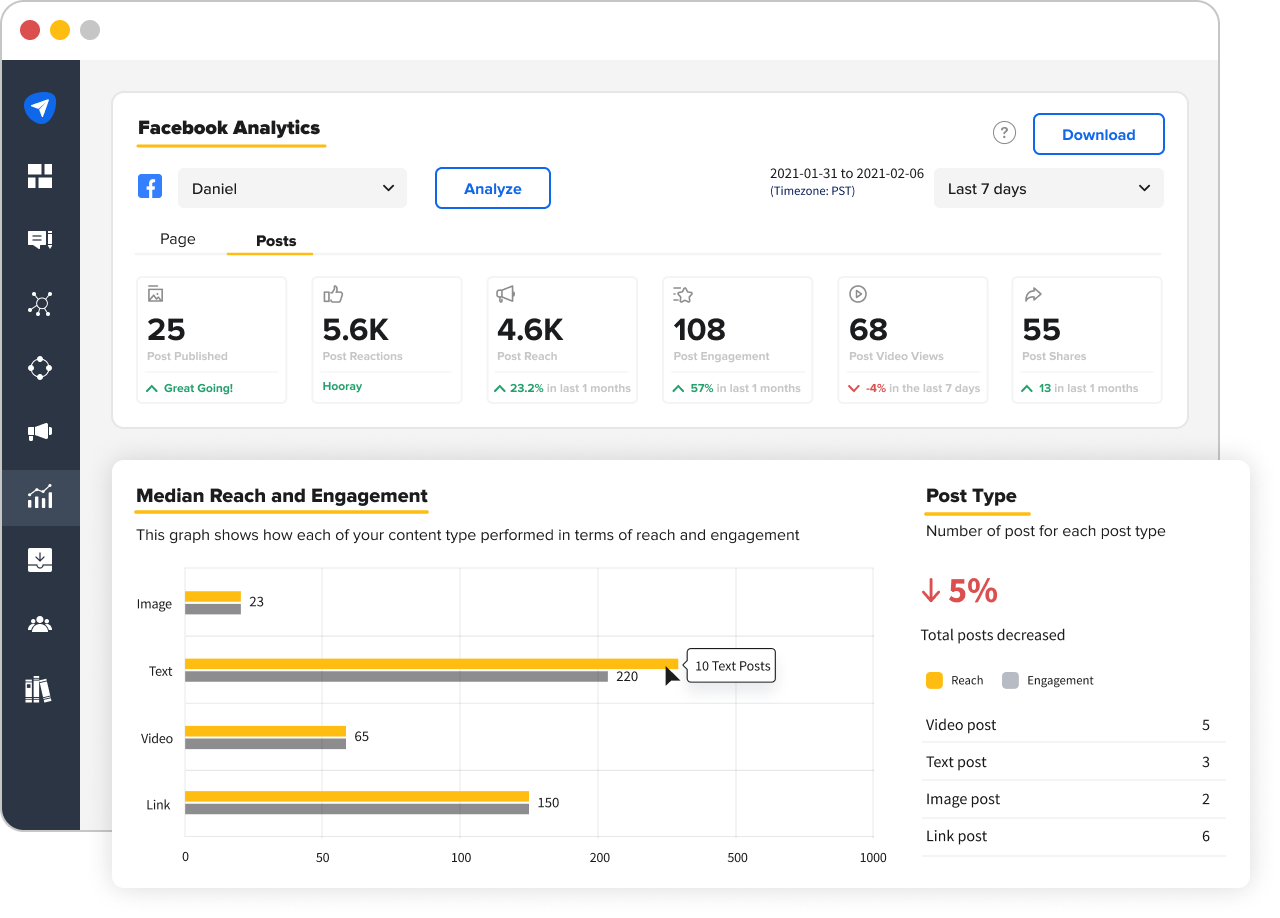
Overview in the Post section shows us a bird’s-eye view of the most important post performance metrics. Let us go through each one of these metrics one by one:
Posts Published - This metric gives you the total number of posts that have been posted during the time which you have selected to view the analytics for.
Post Reactions - This refers to the number of likes or other reactions received on your content that has been published during the selected time period.
Post Reach - The number of people on whose screens any content from your page has appeared.
Post Engagement - The number of people who liked, commented, shared, or performed any type of click on the posts published in the specified period of time.
Post Video Views - Total views on video posts published during the selected time period.
Post Shares - Total number of times your posts that were published during the selected time period got shared on the platform.
Except for post published and post reactions, every metric under the post overview section is given along with the percentage of its change compared to the number in the previous time period.
This section will give you an overall idea of how your content strategy on Facebook is working out.
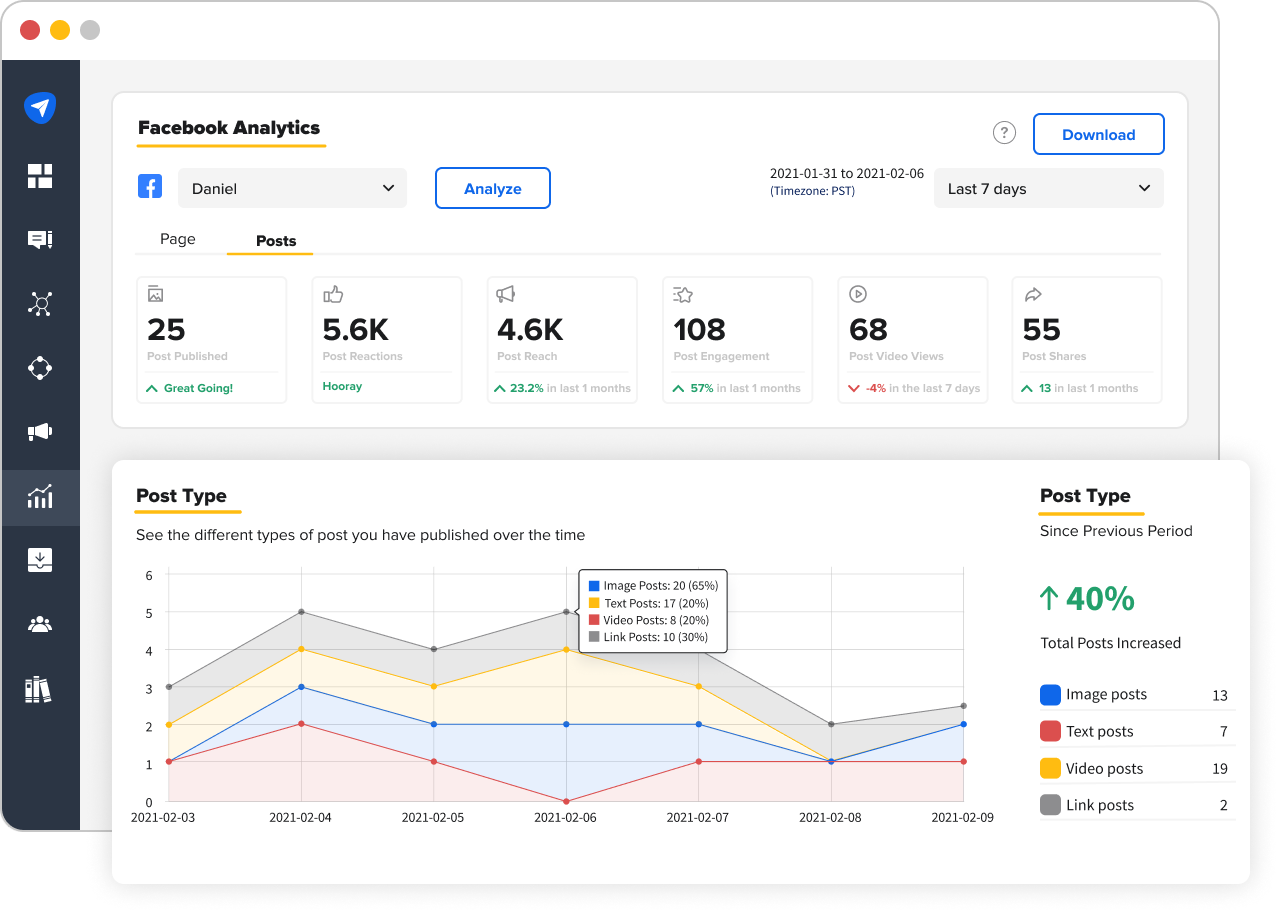
Post Type
The details about the post type are given just below the Post overview section, as you can see in the above image. This section represents a graphical view that distinctly points to the number of posts from each content type you have published. If you hover over a particular point on the graph, it will give you the exact numbers as well as the percentage break-up for each type of post. So you can see how many image posts you have published in the chosen time frame or the number of link posts, videos, or text posts you have published.
On the right-hand side corner, you will see the total of each type of content published on your page, along with a percentage change in the total number of posts published in the currently selected time period compared to the previous one.
Median Reach and Engagement
Shows the comparative view for reach and engagement for each type of content you post on your Facebook page. We do this by finding the medians of the reach and engagement for every type of post so they can be compared more sensibly. This pretty much gives us a clear picture of which type of your content is being liked by the audience the most.
Here too, like in the previous section, the percentage of increase or decrease in the total number of posts is shown on the right margin. This helps you envision your content strategy and adjust it according to the dynamic taste of your audience.
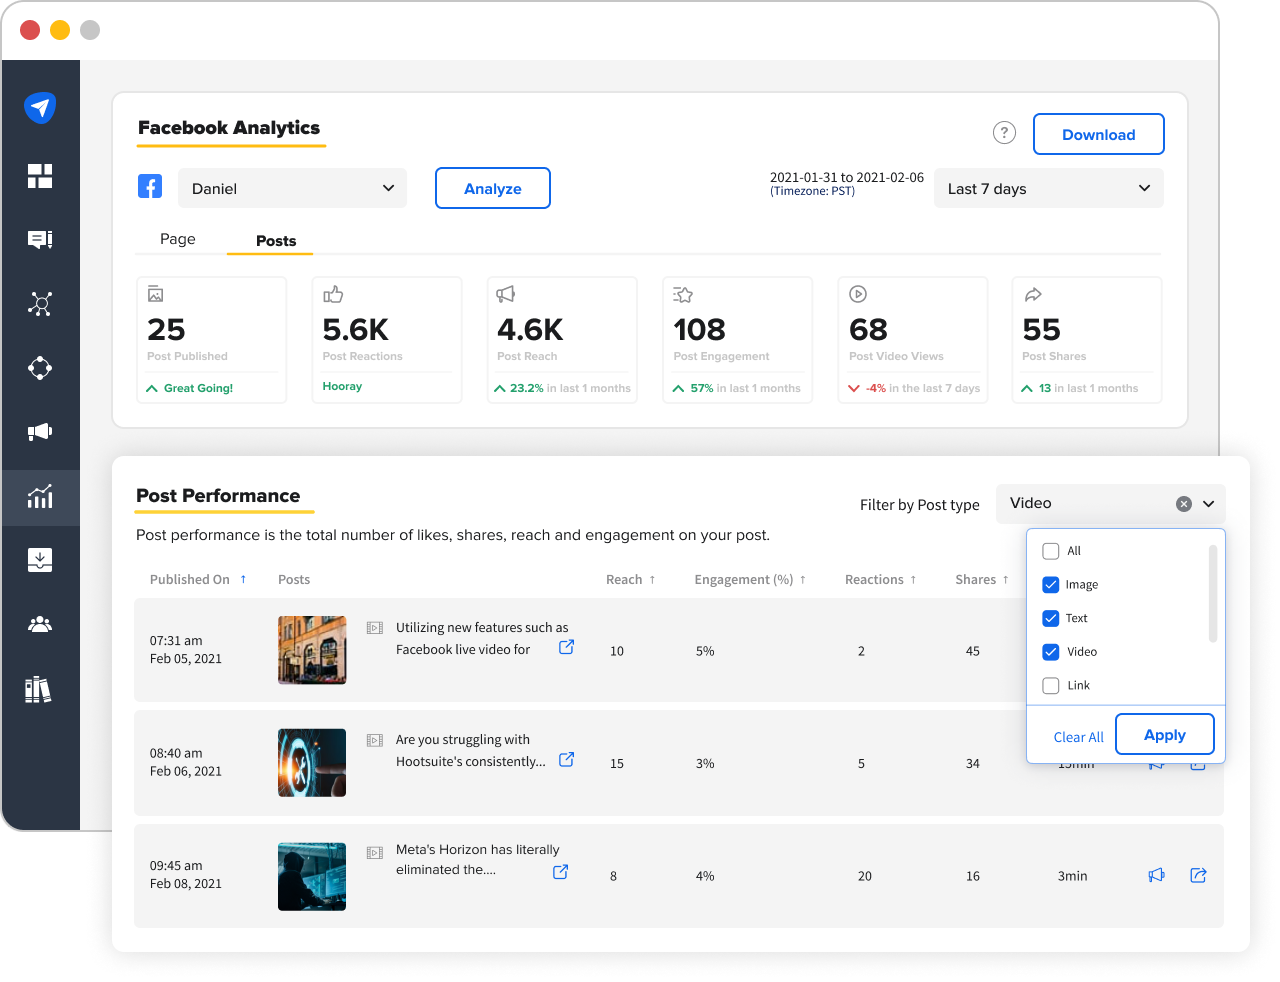
Post Performance
Details the reach, engagement rate, reactions, and shares for all your individual posts shared during the specified time period. Along with the aforementioned metrics, you can also see view times for your videos and reels in this section. You can sort this list based on the types of posts.
The engagement rate for each post is calculated by number of people who liked, commented, shared, or performed any type of click on the post as a percentage of the total number of people who saw it. Reshare the best-performing posts right from the analytics dashboard to boost your Facebook engagement and visibility.
Note: Please note that the reposts for Facebook Pages and Instagram Business accounts can only be presented in the PST timezone, as that is a restriction by Facebook.
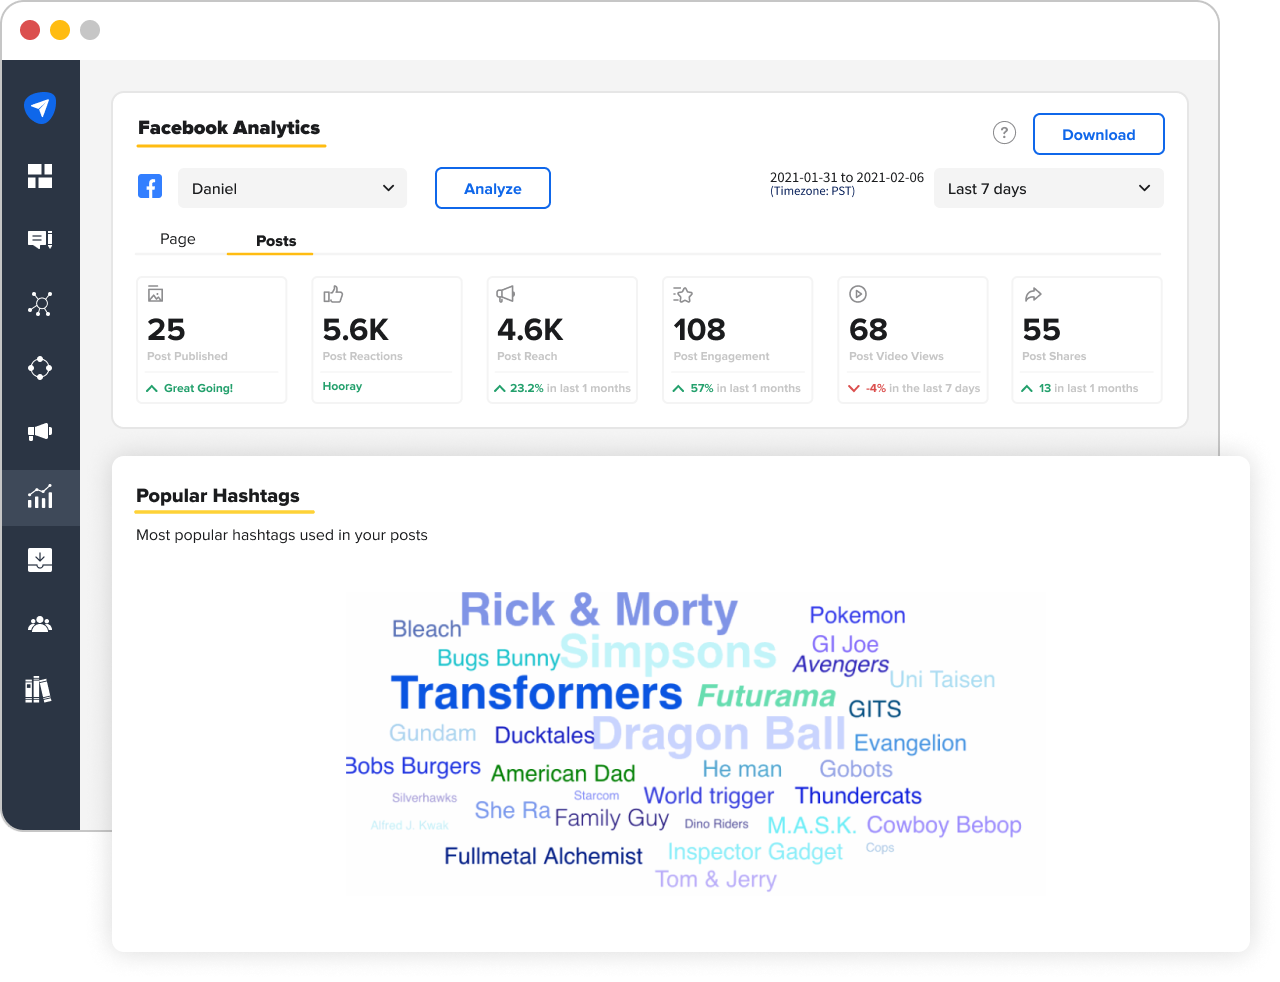
Popular Hashtags
At the end of the Post section gives a visual representation of some of the most popular hashtags you have used in your content.
Advanced Reports Access
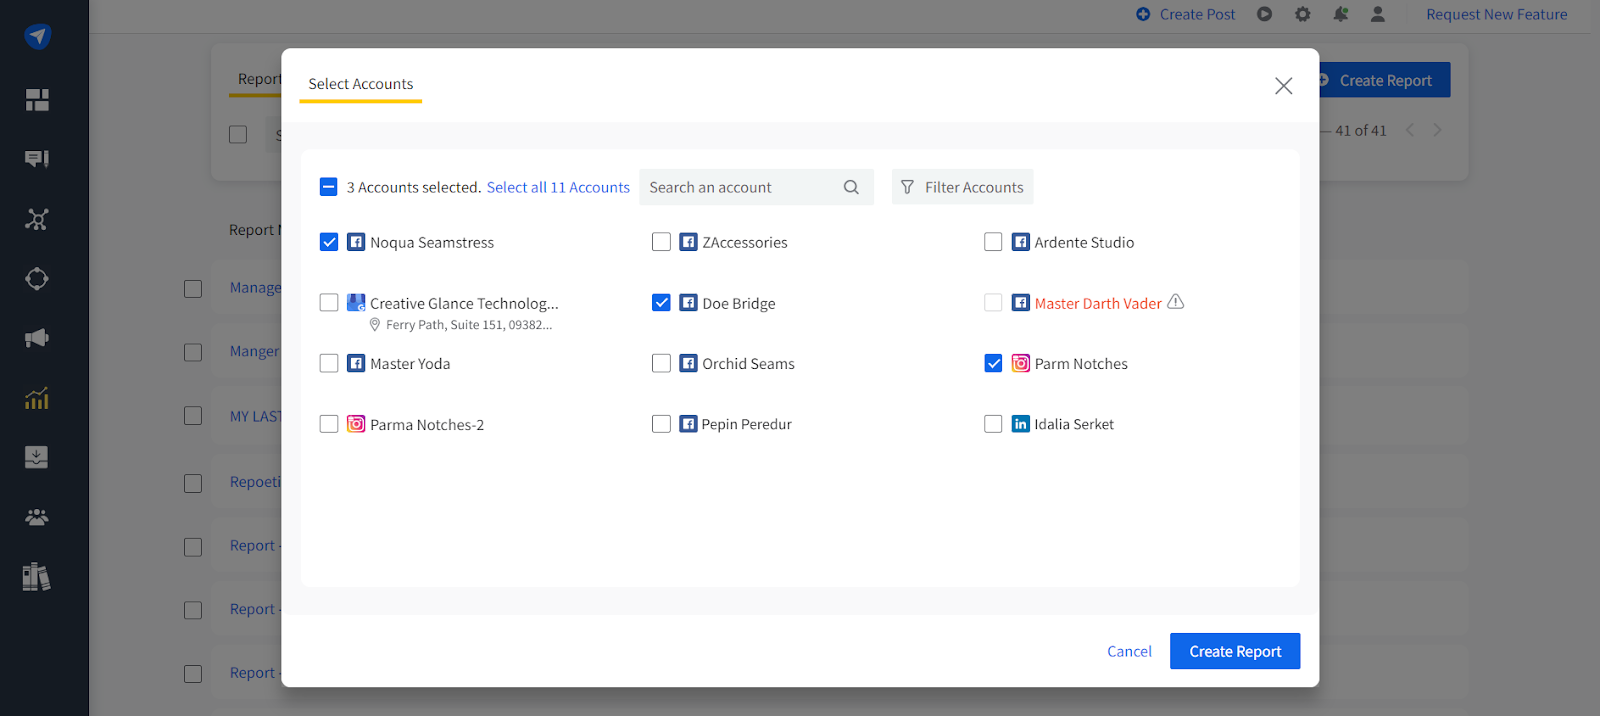
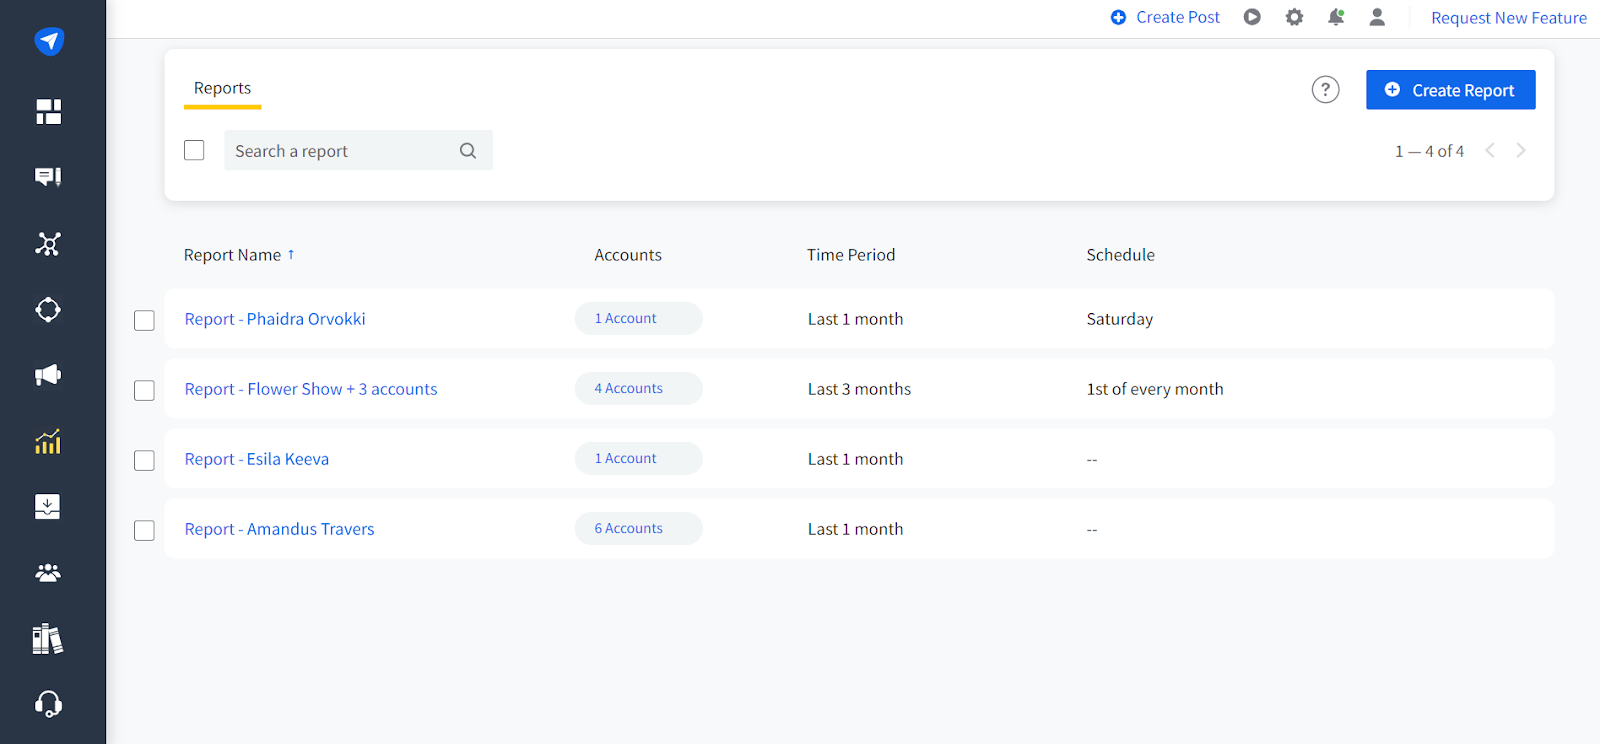
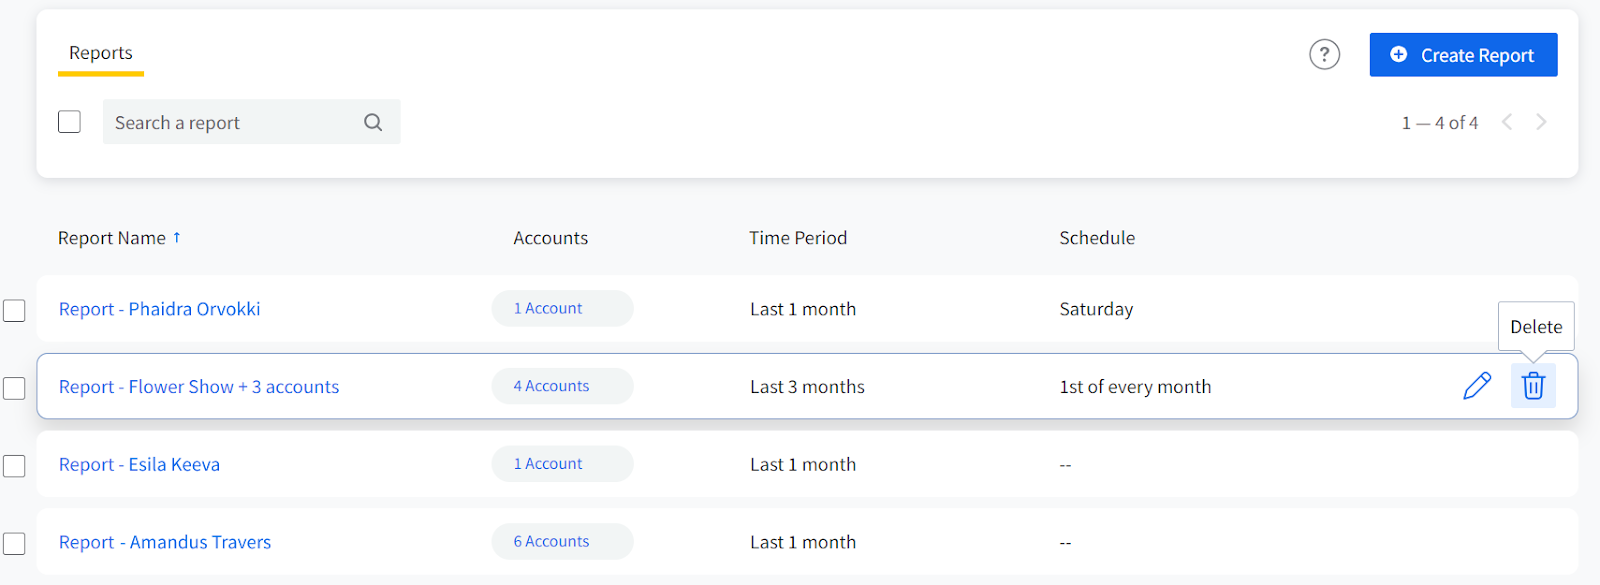
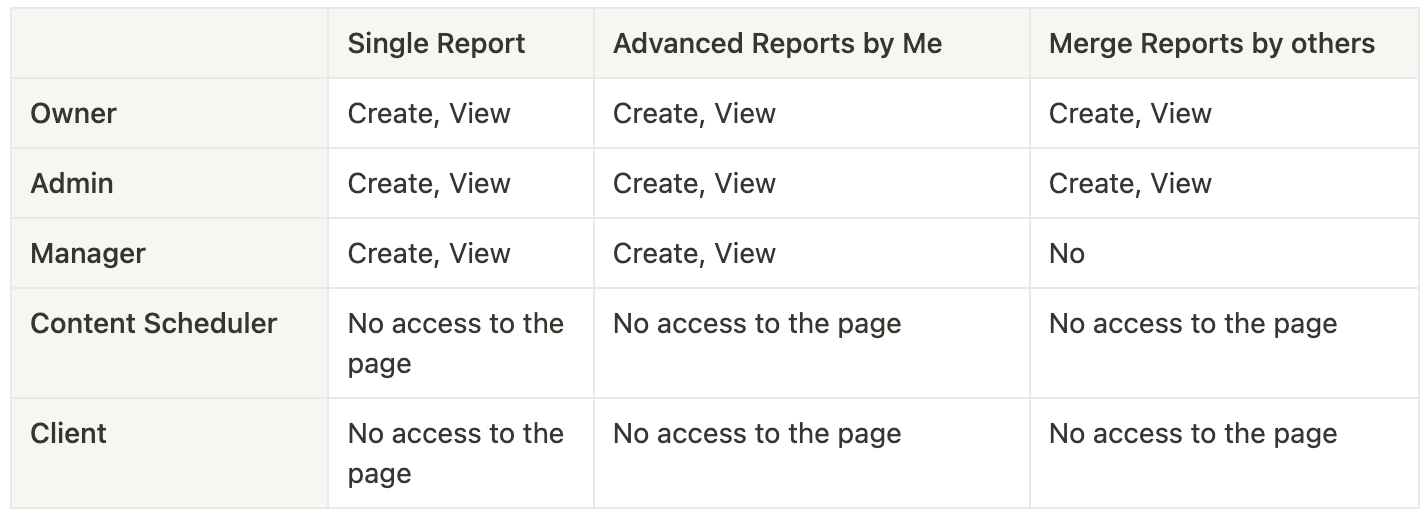
Advanced Reports are not accessible to every team member of a Antler App account. Here is the summarized view of the access to single-account reports and combined reports.
Owner - They can create as well as access all kinds of reports, irrespective of who created them.
Admin - They, too, can create and access every report as an owner does.
Manager - They can create advanced reports and single account reports, but they can’t view or access merge reports created by any other member of the team.
Content Scheduler and Client - They have no access to the Manage Reports page, but they can still create single account reports from Analytics.
Notes:
If an account in an Advanced Report gets disconnected/removed from Antler App due to any reason, the analytics of it won't be available in the report.
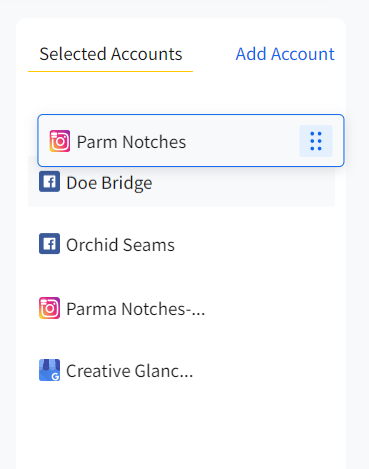
If a Manager creates an Advanced Report with accounts A, B, and C and the Admin or Owner takes away access to account B from the Manager, then the analytics data from account B will be omitted from that Advanced Report.
It's worth mentioning that the Manage Reports page and its functionalities are only available for users with Agency plan or above. If you are on a Professional or Small Team plan, you need to update to the higher plans.


 />
/>